The S&P 500 (SPX) Elliott wave pattern suggest more downside action.
The 30 – minute SPX chart courtesy of Trading View illustrates its presumed Elliott wave count since its all-time high on 12/06/24.

The SPX since 12/06/24 appears to be developing a series of “one’s” and “two’s” to the downside. This is a very bearish configuration and implies a deep sustained downtrend is underway.
Please note that the presumed Minuette wave ( i ) could be just the beginning of a larger Minute wave [ iii ]. If so it implies several large down days similar to what happened on 12/18/24 coming soon.
The 10 – minute SPX chart zooms in on the action since 12/16/24.

The 12/19/24 blog “U.S. Stocks Ready to Bounce?” noted two possible scenarios.
“ If the SPX 12/20/24 session opens above the 12/19/24 session low there’s a good chance for at least a one- day rally”.
And.
“If the SPX 12/20/24 open is decisively below the 12/19/24 low there’s a good chance of more downside action throughout the 12/20/24 session”.
What happened was a break below the 12/19/24 low followed by a massive rally.
The 12/19/24 blog illustrated that the SPX may have completed an Elliott wave – Ending Diagonal Triangle near the end of the 12/19/24 session. There are always alternate wave counts. Ending Diagonal Triangles are trending patterns composed of five – waves, each which subdivide into three waves. Horizontal Triangles are sideways patterns composed of five- waves, each which subdivide into three waves.
Because of their similar structures a Horizontal Triangle is the alternate count to a presumed Ending Diagonal Triangle.
In this case what could have been a completed Ending Diagonal Triangle was a completed Horizontal triangle, and the beginning of the next motive wave down.
The 1 – minute chart focuses on an important Elliott wave phenomenon.
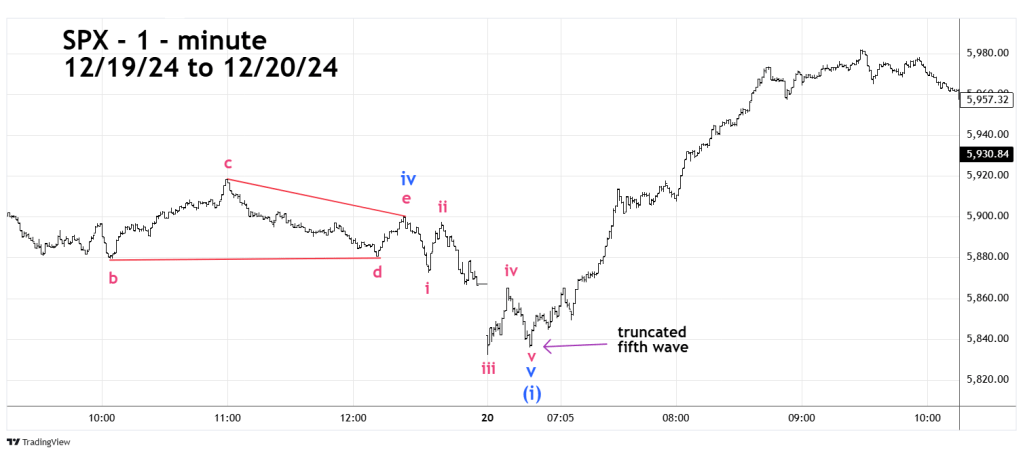
Roughly about 85 to 90% of the time the fifth wave of a motive pattern will exceed the termination point of the third wave of a motive pattern.
When the fifth wave fails to exceed the termination point of the third wave it’s called a truncated fifth wave. These waves cannot be predicted and are usually discovered well after the fact. This phenomenon occurred between 6:39 AM – ET and 6:50 AM – ET when the decline failed to exceed the SPX opening session bottom. This type of action can be very frustrating to a practitioner of Elliott because of missed opportunities. In this case if you were waiting to go long on a move below the SPX 12/20/24 bottom its probable no action was taken at the higher 6:50 AM – ET bottom.
Truncated fifth waves in a down trend usually are the prelude to very bullish movements, which is what happened.
The sharp rally on 12/20/24 could be the “a” wave of an Elliott wave – Single Zigzag. If so, there’s a good chance for the SPX to rally beyond its 12/19/24 high sometime on 12/23/24 or 12/24/24.
If this bull move happens the news media will probably call it a “Santa Claus” rally.
This presumed bullish “gift” could turn into a stocking full of coal in early 2025.

Mark,
Thanks for the technical analysis in 2024. Do you analyze the US10Y?
I hope you and yours have a very Happy Holiday.
Mike
LikeLike
Hi Michael
Thanks for the question. I’ve done a few blogs of the US10y in conjunction with the US30Y. I will updated the situation of the US10Y in my next blog about U.S. interest rates.
Have a great Holiday.
Mark
LikeLike
Hi Mike
I’ve posted a blog about the U.S. 10 Year Treasury Note.
Mark
LikeLike
Thanks, Happy New Year.
LikeLike