On 12/18/24 after the U.S. – FOMC decision the S&P 500 (SPX) decisively broke below the rising trendline connecting the 08/05/24 and 11/04/24 bottoms.
The daily SPX chart courtesy of Trading View examines the situation.
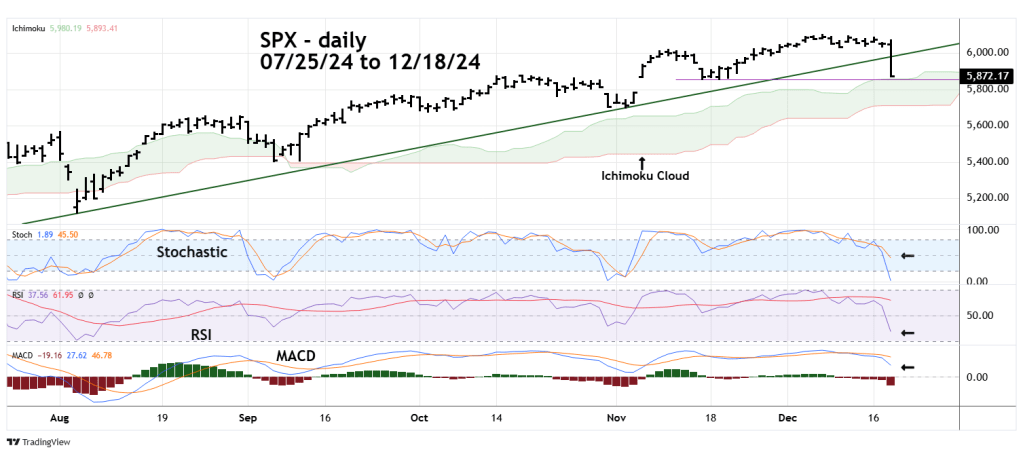
Daily momentum indicators imply more downside action.
Only one line of Stochastic has reached the oversold zone.
RSI is in the neutral zone.
MACD has just begun a downside rollover.
Upcoming challenges for the bears are the upper line of the Ichimoku Cloud, and 11/15/24 chart support at 5,853.01. These barriers could trigger a short- term bounce.
There’s a good chance the SPX declines at least 10% from the 12/06/24 peak before the end of December 2024.
