Tesla Inc. (TSLA) was lagging the broader U.S. stock market, now its emerging as a leader. This renewed strength could extend the rally in U.S. stocks.
The main characteristic of the U.S. stock market in 2024 has been narrow leadership. While many stocks have failed to make new 52-week highs, a small minority, particularly the “Magnificent Seven” have contributed much to the market gains.
The Magnificent Seven stocks are: Apple Inc. (AAPL), Microsoft Corporation (MSFT), Alphabet Inc. (GOOGL), Amazon.com Inc. (AMZN), Nvidia Corporation (NVDA), Meta Platforms Inc. (META) and Tesla Inc. (TSLA).
Even within this elite group the leadership has been narrow. On 12/06/24 while the S&P 500 (SPX) was reaching a new all-time high, only three of the Magnificent Seven stocks were making new highs. They were AAPL, AMZN. and META.
TSLA could soon be making a new all-time high. The monthly TSLA chart courtesy of Trading View shows its performance since its inception in June 2010.
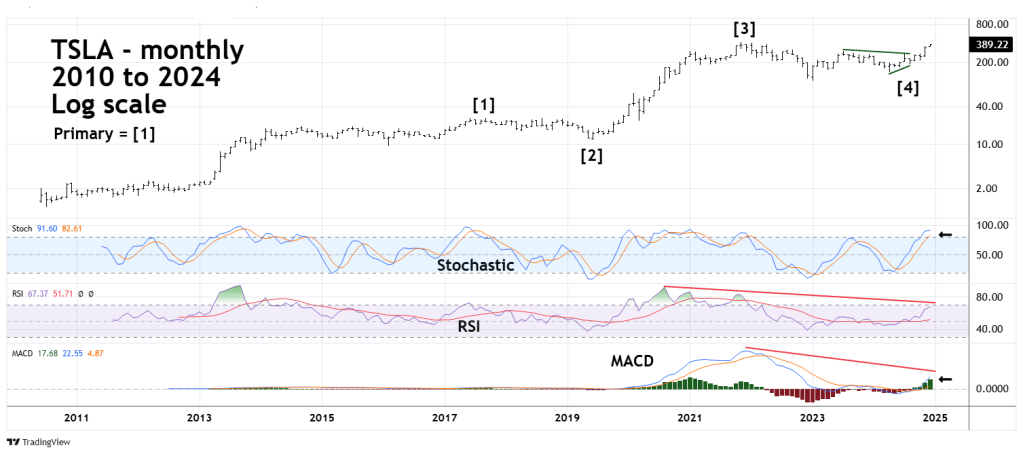
TSLA made its all-time high in November 2021 at 414.50 and then had a crushing 75% decline bottoming out at 101.81 in January 2023. Some said that TSLA should not be considered part of the Magnificent Seven. Its subsequent rally has been magnificent. On 12/06/24 TSLA reached a high of 389.49 only 6% below its all-time high.
Both monthly Stochastic lines are in the overbought zone which begins at 80.00. Monthly RSI and MACD have bearish divergences. However, MACD – Histogram is still rising implying additional upside action.
The weekly TSLA chart gives a clearer picture of potential action in the coming weeks.

TSLA from November 2021 to August 2024 appears to have completed an Elliott wave – Horizontal Triangle. If so its probably now in a developing Primary wave [5] rally that’s likely to make a new all-time high.
Both weekly Stochastic lines are in the overbought zone. Please note the prior instances when both lines were in the overbought zone. It could be several weeks before the downturn begins.
Both weekly RSI and MACD have no bearish divergences, implying more upside action.
There’s a high probability TSLA could soon make a new all-time high which could contribute to further rally of the main U.S. stock indices.
There’s also the possibility that TSLA could make new highs after the main U.S. stock indices have reached a significant peak. If this scenario develops it could slow the decline of a developing bear market in U.S. stocks.
