On 11/20/24 Nvidia Corporation (NVDA) released their third quarter of 2024 financial results. They beat revenue expectations by 5.96%. On 11/21/24 NVDA reached a new all-time high and ended the session up by .78% from the prior session closing price.
The weekly NVDA chart courtesy of Trading View illustrates the long -term Elliott wave count.

NVDA could be in the fifth Intermediate degree wave up from the October 2022 major bottom.
Both weekly Stochastic lines are in the overbought zone which begins at 80.00. So far there is no bearish lines cross.
RSI has multiple bearish divergences and MACD has significant bearish divergence.
The daily NVDA chart zooms in on the more recent action.
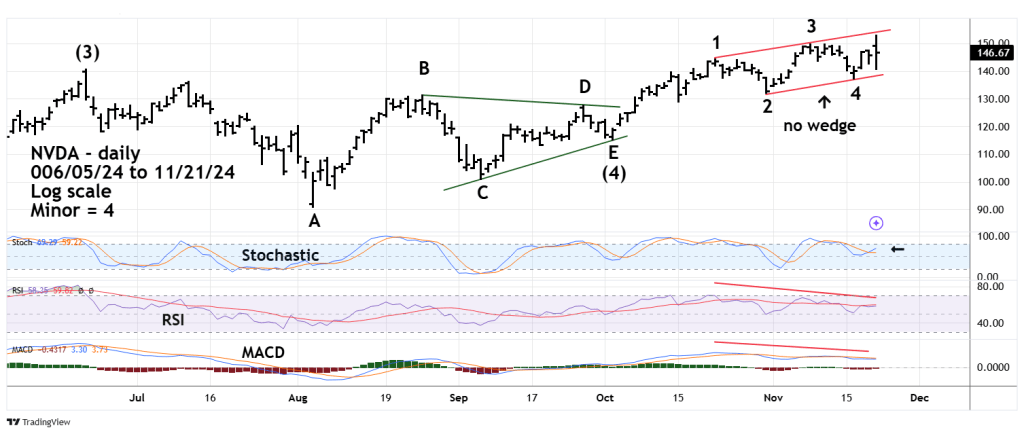
The movement from the 06/20/24 top to the 10/02/24 bottom appears to be an Elliott wave – Horizontal Triangle. This structure only appears in the fourth wave position of motive patterns and in the wave “B” position of corrective structures.
The subsequent rally could be an Elliott wave – Ending Diagonal Triangle (EDT) which is the termination wave of the larger degree movement. EDT’s almost always have converging wedge trendlines. This supposed EDT has no wedge and implies there could be more upside action.
Supporting the theory for higher prices is a bullish lines cross in the daily Stochastic neutral zone. Both daily RSI and MACD have double bearish divergences.
Watch the 10/31/24 bottom at 132.11. A break below that support could be the start of a multi-month decline.
