Trading action in the next few days could determine the direction of U.S. long – term interest rates for several weeks.
The daily CBOE 10 – year Treasury Yield (TNX) chart courtesy of Trading View shows its progress since mid – 2023.
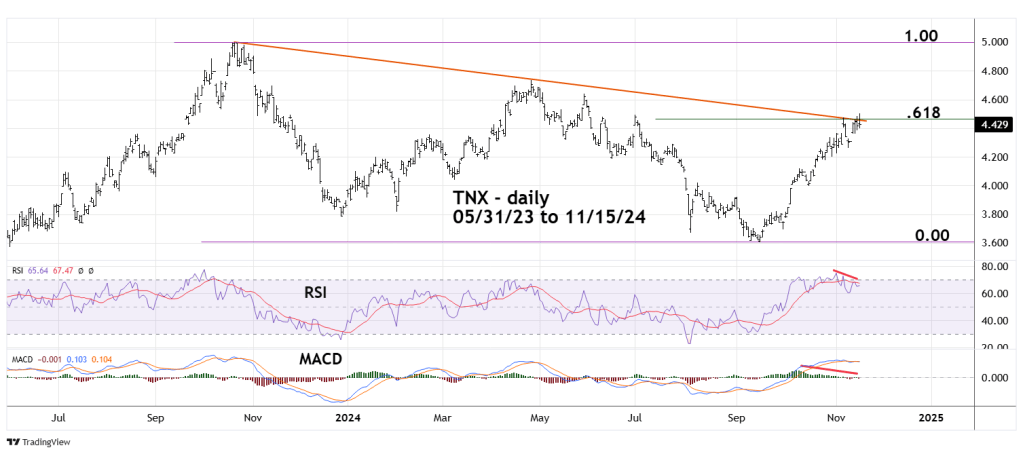
TNX has moved marginally above the declining trendline connecting the October 2023 and April 2024 peaks.
TNX has moved marginally above the Fibonacci .618 retracement level of the October 2023 to September 2024 decline.
TNX has moved marginally above the short – term top made on 07/01/24.
The key word is marginal. The upside breakthroughs imply further rally. However, there’s always leeway around support/resistance levels. So far none of the breakthroughs are decisive enough to assume the bull move could continue.
Supporting the theory that TYX has made an intermediate peak is evidence from momentum oscillators. Daily RSI has a double bearish divergence. MACD – Histogram has a significant bearish divergence.
The next daily chart illustrates the action of 30 – year Treasury Yields (TYX).
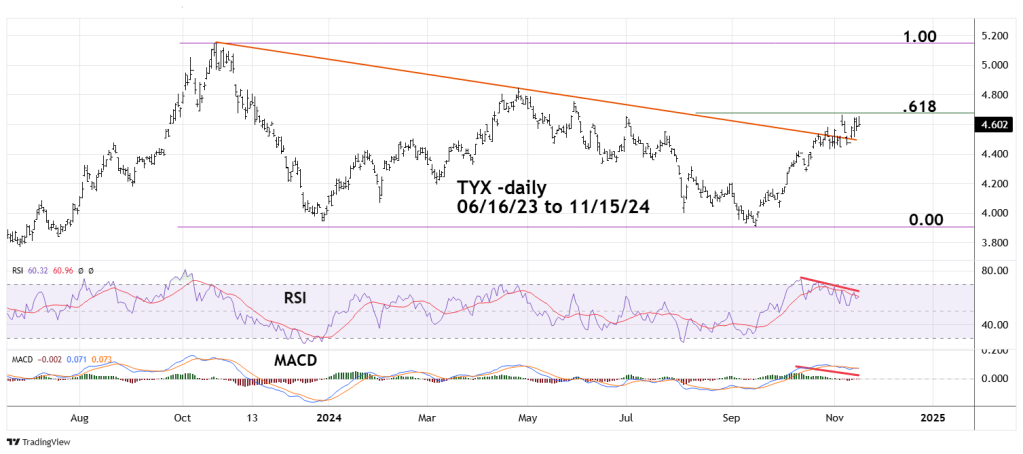
The message from TYX is slightly more bullish because of the decisive breakthrough of its multi- month declining trendline. However, its most recent high is within the lower leeway for the Fibonacci .618 retracement level.
RSI and MACD – Histogram have bearish divergences.
In persistent up or down trends divergences can be erased. If prices continue to rise, the erasure of the bearish divergences could signal a powerful bull move.
The important TNX upside level is the 11/15/24 high at 4.505. A move above that level could signal additional upside action until the end of 2024. A move below the 11/08/24 bottom at 4.264 could herald a multi – week decline.
The important TYX upside level is the 11/06/24 peak at 4.666.
Important TYX support is the 11/08/24 bottom at 4.456.
