Gold may have completed the first wave down of a multi-month decline.
The daily Gold Futures Continuous contract courtesy of Trading View updates the action.
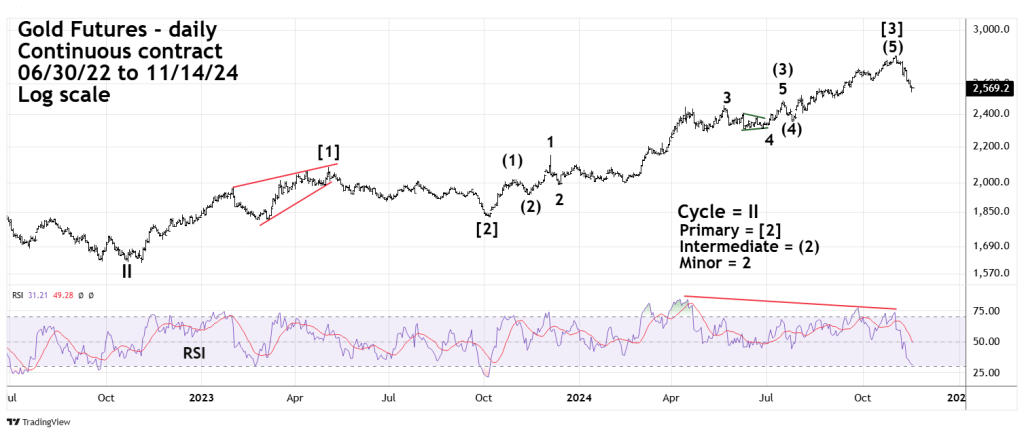
The Gold bull market from the October 2022 bottom appears to have made a Primary degree peak on 10/31/24. October 2024 top had a double bearish RSI divergence, and the subsequent declines has the look of a sharp steady Impulse wave. If so it could be the first wave of a larger developing bear market.
The next daily chart illustrates Gold futures – Volume Profile.
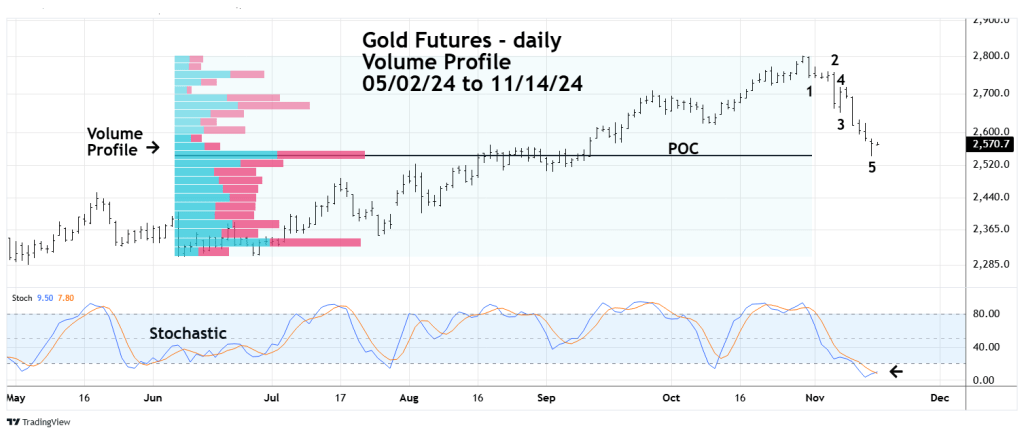
Volume Profile analysis places volume on a vertical axis which helps to clarify support and resistance area’s. The widest part of the Volume Profile is called Point of Control (POC) and represents the strongest potential support/resistance.
The price low on 11/14/24 bottomed exactly at the POC of the rally from June to October 2024. Supporting the theory that a short-term bottom could be in place is the daily Stochastic. Both lines have reached the oversold zone which begins at 20.00 with bullish lines cross.
If a short-term bottom is in place Gold could have a multi- day rally that fails to exceed the 10/31/24 high. This retracement could be the first bear market rally of a larger developing decline.
