The 10/13/24 blog “ U.S. Stock Market Momentum and Sentiment – 10/11/24” illustrated bearish evidence for both dimensions. One month later the situation for one of the dimensions dramatically changed.
The NYSE 52 – week highs chart courtesy of Barchart.com shows internal momentum.
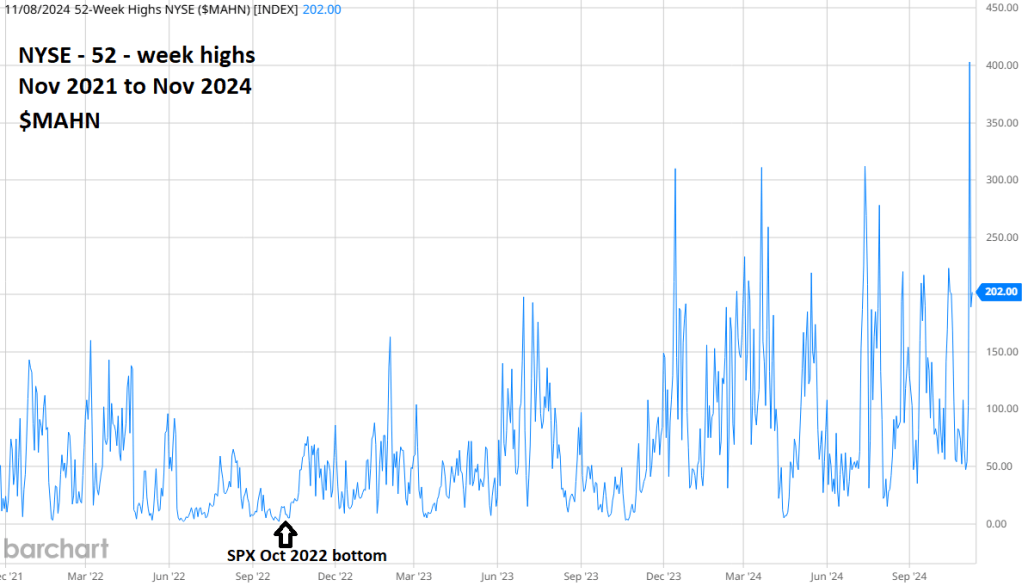
In early October 2024 there was a double bearish divergence for NYSE – highs vs. its mid-July peak. The post U.S. election surge has blow away the divergences to record its highest level in two years!
This phenomenal move is the type of action recorded in the middle of bull phase. The current bull market in U.S stocks began in October 2022. The surge in new highs implies the bull market could continue to run for another one or two years.
However, readings from the sentiment dimension tell a different story.
The daily S&P 500 (SPX) chart courtesy of Trading View illustrates some Market Vane – Bullish Consensus readings.

The Bullish Consensus measures the Futures market sentiment each day by following the trading recommendations of leading Commodity Trading Advisors.
High readings correspond to tops, low readings with bottoms. For U.S. stocks readings over 65% usually indicate a potential significant top.
The 10/13/24 blog illustrated that the October 2024 SPX peak had a Bullish Consensus reading of 71% vs. the sentiment peak recorded at the mid – July top, a bearish sentiment divergence.
The most recent Bullish Consensus read was again 71%. These levels imply the SPX could be in the late stage of a bull market. A significant SPX peak could be made in days or at most a few weeks.
As for the time dimension November is seasonally the most bullish month for U.S. stocks.
With a mixed picture among the market dimensions price could be the deciding factor. As noted in this websites prior blog,
“The Elliott wave action during the next two weeks could be very important.
Termination of the bull market or an extension of the rally into 2025? A break below the 11/04/24 bottom could provide the answer.”
