The day after the election of Donald Trump as the U.S. president in 2016 the S&P 500 (SPX) had a big rally which kicked off for a multi month bull market. The day after Donald Trump’s reelection in 2024 the SPX had a big rally. Could this be the start of another multi month bull market? Comparison of the two markets reveals some fascinating information.
The weekly SPX chart courtesy of Trading View illustrates what happened prior to and after the U.S. November 2016 election.

From August 2016 to October 2016 the SPX declined 5%. Momentum oscillators are like fuel gauges for markets. Low readings prior to a bull move imply fuel for a sustained rally. High readings generally imply shorter moves up.
The weekly RSI reading one week before the November 2016 election was 43. Weekly Stochastic lines had readings of 16 and 29. Subsequently the SPX rallied 37% into a peak made in January 2018.
The next weekly SPX chart examines its action from August 2023 to November 2024.
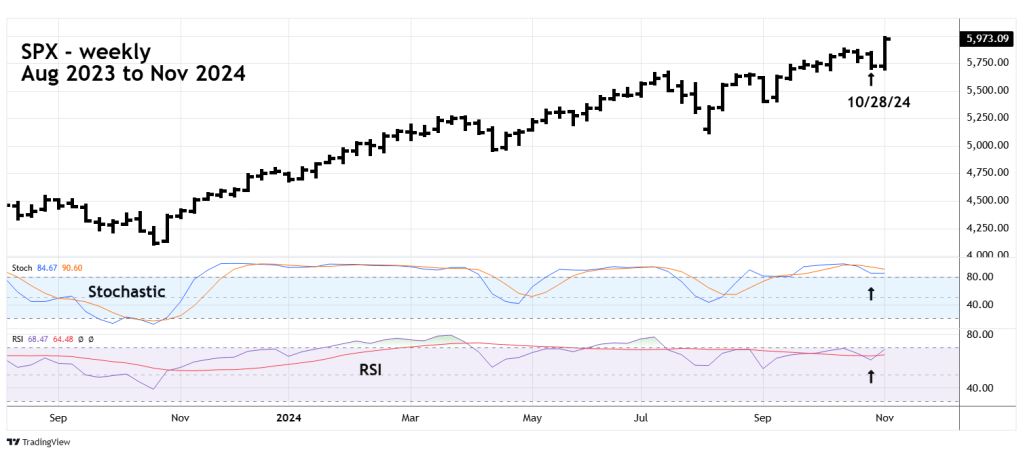
Just prior to the November 2024 election the SPX had a two – week 2% decline.
The weekly RSI reading just prior to the election was 60, the Stochastic lines were at 84 and 93, both in the overbought zone which begins at 80.00.
The recent weekly readings imply the SPX could be closer to a top than the start of a sustained multi month bull market.
The momentum readings suggest the SPX rally could last for days not months.
The next blog will examine the Elliott wave structure for the SPX and the Russell 2000 – small cap stock index.
