The 10/26/24 blog “Russell 2000 – Impulse Down – Part Two” illustrated that the Russell 2000 (RUT) may have made an important short-term peak on 10/25/24. Subsequently RUT moved above the 10/25/24 top and reached 2,260 on 10/30/24. Momentum evidence continues to suggest that RUT could reach the 2,000 area in one to two weeks.
The weekly RUT chart courtesy of Trading View shows the long-term momentum.
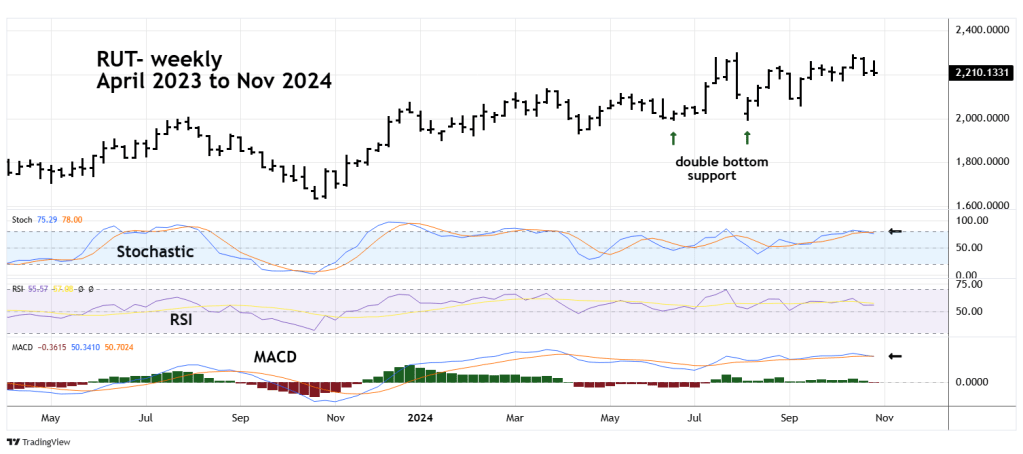
Both weekly Stochastics and MACD have bearish lines crosses. RSI is in the neutral zone and far from the oversold zone which begins at 30.00.
The daily RUT chart focuses on recent action.
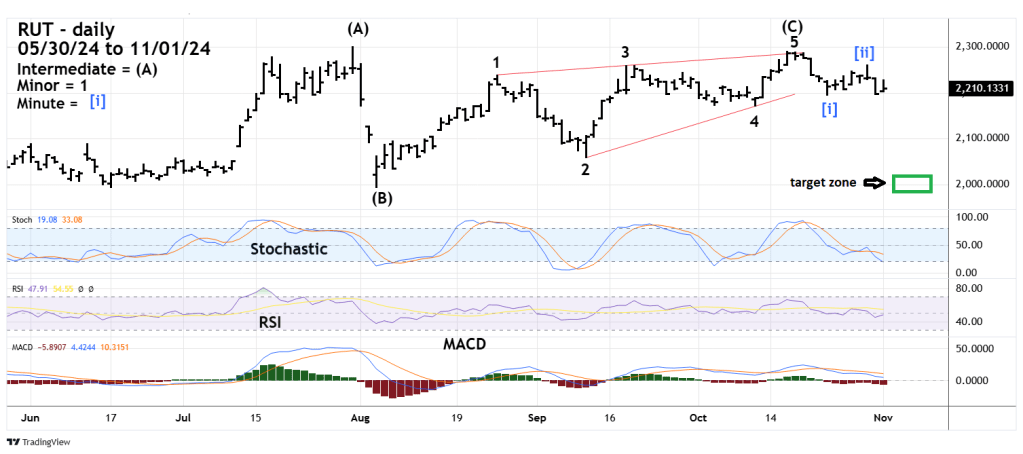
The RUT August to October rally counts best as an Elliott wave – Ending Diagonal Triangle. After completion of this pattern there’s usually a rapid retracement to the triangle point of origin, which in this case is the 08/05/24 bottom.
The lower Stochastic line has reached the oversold zone boundary. In strong down moves daily Stochastic could remain in the oversold zone for more than a week.
RSI is in the neutral zone, MACD is trending down, and lines have yet to move below the “zero” level.
The important level to watch is 2,195.46 the presumed Minute wave [i] bottom made on 10/23/24. A break below this bottom could mean Minute wave [iii] is underway, if so RUT could be in a in a steep and powerful drop.
