The 09/15/24 blog “Microsoft and Alphabet Inc. Elliott Wave Patterns” illustrated resistance zones where both stocks could peak. Subsequently their respective upper price targets have been reached and new declines have begun.
The daily Microsoft (MSFT) chart courtesy of Trading View shows the Elliott wave count since its 07/05/24 peak.
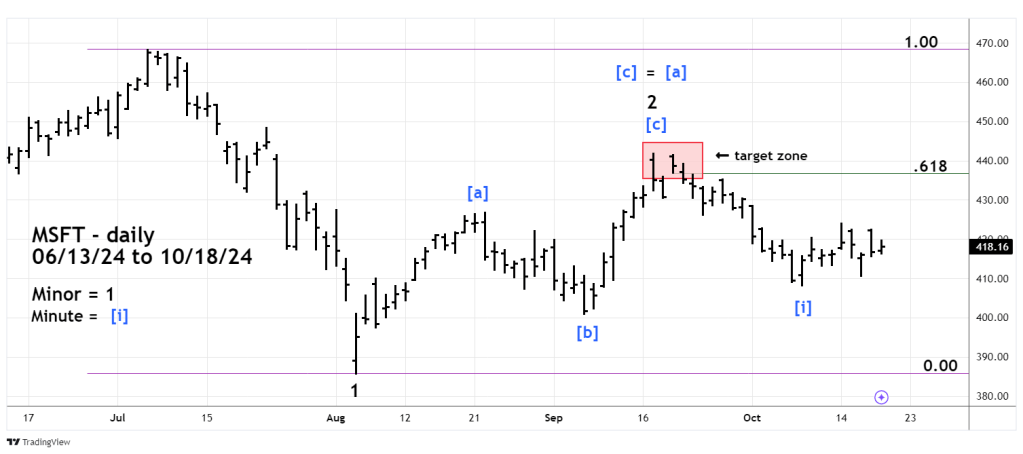
MSFT – 07/05/24 to 08/05/24 decline has the characteristics of an Elliott wave impulse pattern. If so it could be the first wave down of a larger developing bear move. The subsequent rally looks very much like an Elliott wave – Single Zigzag.
The 09/15/24 blog illustrated an upper target zone from 434 to 444. This target was based on two factors: a Fibonacci .618 retracement of the 07/05/24 to 08/05/24 decline and the Fibonacci relationship between Minute wave [a] and [c].
As it turned out Minute wave [c] equaled Minute wave [a] which is a common relationship in Single Zigzags. Additionally Minute wave [b] retraced .618 of Minute wave [a] also a common relationship in Single Zigzags.
The decline from 09/17/24 to 10/08/24 looks like another impulse pattern, if so the next decline could break decisively below the 08/05/24 bottom.
The daily Alphabet Inc. (GOOGL) chart illustrates what happened after its 07/10/24 peak.
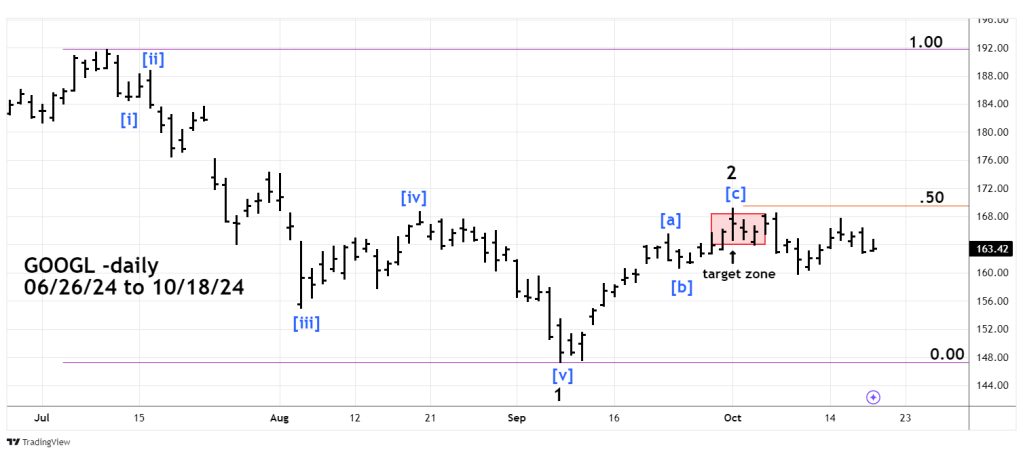
GOOGL marginally exceeded the target zone that ranged from 164 to 168. Its peak on 10/01/24 was just below a Fibonacci .50 retracement of the 07/10/24 to 09/09/24 decline and just above the 08/20/24 peak labeled Minute wave [iv].
If the post 10/01/24 decline continues a move below the 10/09/24 bottom at 159.74 could open the door for a move down to the 09/09/24 bottom at 147.22
The bottom made on 09/09/24 is important. A break below 147.22 could be the prelude to a move back to the October 2023 bottom in the low 120 area.
During the post October 2022 bull market MSFT and GOOGL were upside leaders. They could now be leading the way down.
