The S&P 500 (SPX) bullseye target for a long-term Fibonacci time cycle was 10/11/16. On 10/14/24 one trading day later SPX made a new all-time high. The next day SPX failed to make a new high, and of the three main U.S. stock indices only the Dow Jones Industrial Average (DJI) made a new high.
The daily SPX, DJI, and Nasdaq Composite (IXIC) courtesy of Trading View illustrates their relationship.
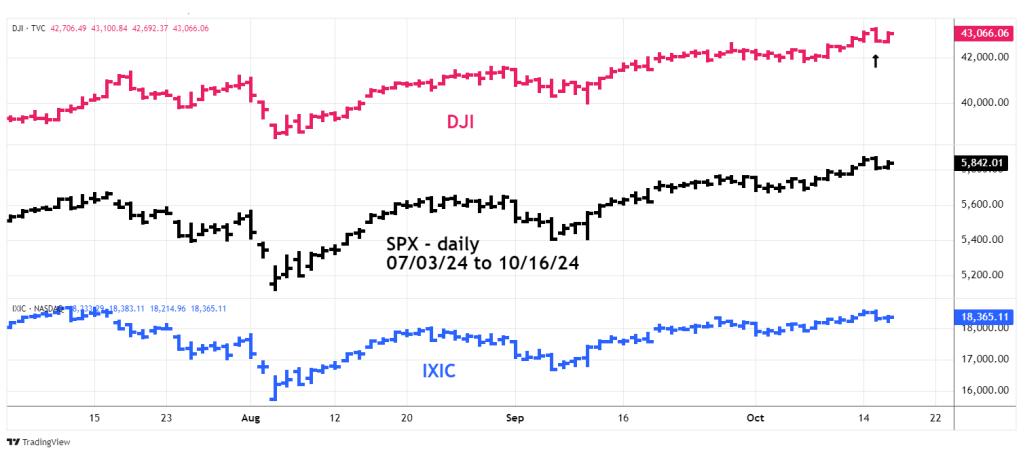
When only one of the three main U.S. stock indices makes a new high/low unconfirmed by the other two indices I call it a “Rule of the Majority” signal. A potential trend changes is signaled by the two unconfirming indices.
This signal coming just after a possible Fibonacci turn date strongly implies a new downtrend may have begun.
However, the Rusell 2000 (RUT) – small cap stocks is giving a different message.
The daily RUT chart shows its prime Elliott wave count since the October 2023 bottom.
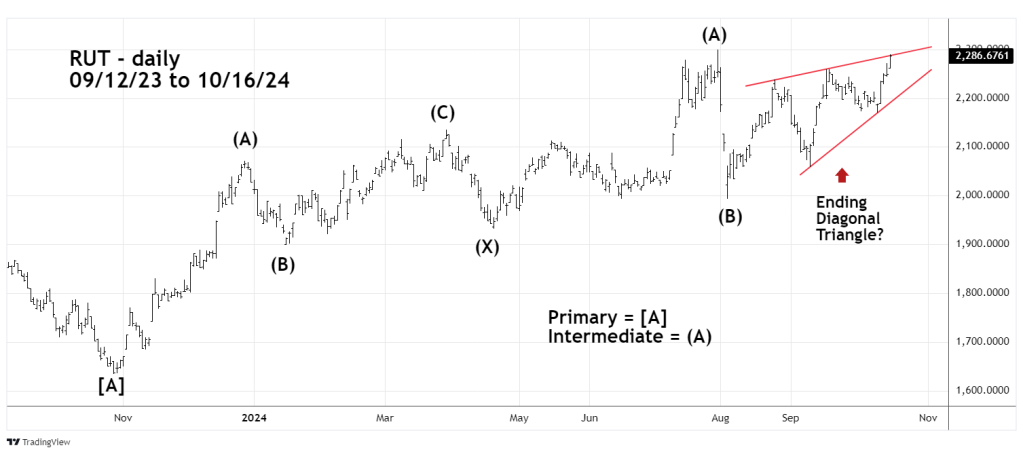
On 10/15/24 all three main stock indices ended the session down; RUT was up on the day and rallied during much of the day while the three main indices went down.
The RUT rally since the 08/05/24 bottom looks like an Elliott wave – Ending Diagonal Triangle (EDT). This structure is a termination pattern of the larger trend.
Typically, an EDT will have a brief throwover of the trendline connecting the termination points of the first and third waves.
On 10/16/24 RUT moved marginally above the rising trendline.
Price action on 10/17/24 could be resolved the mixed signals.
Watch the SPX and DJI, if they both make new highs it will invalidate the bearish signal made on 10/15/24.
If RUT continues to rally and does not close the session below the rising trendline it could put the EDT pattern in doubt.
Traders were stopped out of half of a short position on Russell 2000 non – leverage funds initiated at the open of trading on 09/23/24. The stop loss for half the position was at RUT 2,280. The loss was 1.1%. Continue holding the remaining half of the position with a stop loss above RUT 2,320.
