A web of Fibonacci time cycles indicate that the S&P 500 (SPX) could make a significant turn on or near 10/11/24. Price has risen into the time zone implying a top could form. Price is not the only determining factor to discover potential tops or bottoms. Evidence from sentiment and momentum indicators is needed to confirm market turns.
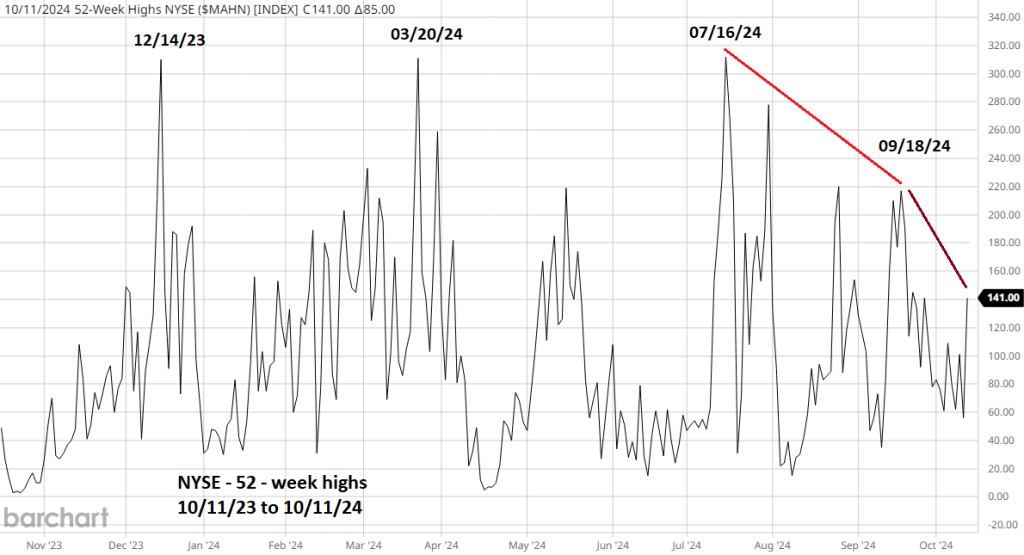
The daily NYSE 52 – week high ($MAHN) chart courtesy of Barchart.com illustrates internal momentum.
In Mark Douglas book “Trading in the Zone” he lists five truths of trading, the first is “Anything can happen”.
This sums up what’s happened with the momentum of U.S. stocks in 2024. The typical momentum cycle for a stock market in rising trends is that a momentum peak is made first then price peaks later on weaker momentum. The time between the momentum peak and price peak could be weeks or sometimes months.
In mid – December 2023 – NYSE 52 – week highs reached their highest level since the bull market began in October 2022. By mid – February 2024 it appeared U.S. stocks were ripe for a multi – month decline. There were bearish momentum divergences, however, these were blown away by a mid-March momentum surge.
Momentum then declined followed by more bearish divergences vs. rising prices. It again looked like prices of U.S. stocks were on the verge of a significant drop. Then there was another upward momentum surge that peaked on 07/16/24.
On 07/16/24 the SPX ended its session at 5,667. On 10/11/24 the SPX ended the session at 5,815 with a significant bearish divergence vs. 52 – week highs. Another upward momentum surge on the horizon? We may have an answer in one or two weeks.
Evidence from the sentiment dimension can confirm or not confirm evidence from the momentum dimension.
The daily SPX chart courtesy of Trading view shows Market Vane – Bullish Consensus readings.
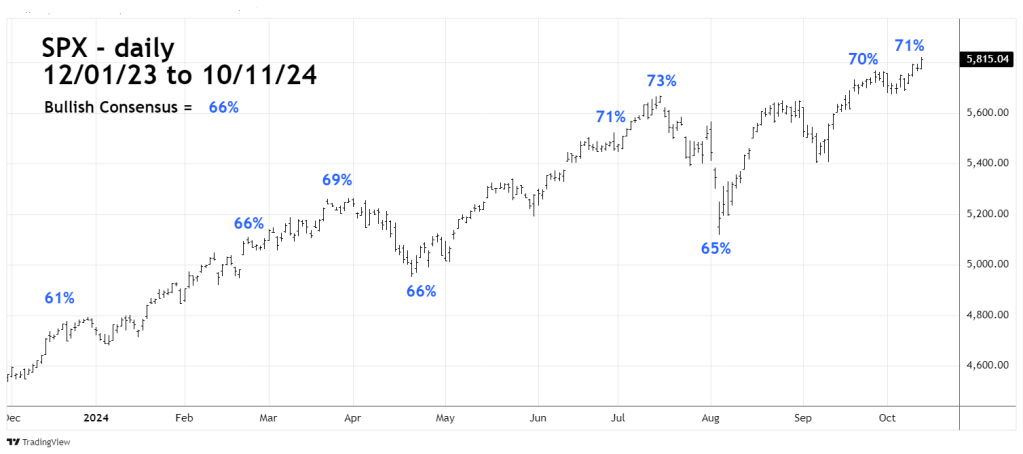
The Bullish Consensus measures the Futures market sentiment each day by following the trading recommendations of leading Commodity Trading Advisors.
High readings correspond to tops, low readings with bottoms. For U.S. stocks readings over 65% usually indicate a potential significant top.
The sentiment peak so far came at the SPX – 07/16/24 top, the same day as the NYSE 52 – week high peak.
At the most recent reading in early October 2024 there’s a sentiment divergence. Could the Bullish Consensus readings exceed it high of 73%? Anything can happen.
Bearish sentiment and momentum divergences going into the 10/11/24 Fibonacci time date implies a significant decline could begin soon.
