A series of Fibonacci time relationship spanning 34 – years imply the S&P 500 (SPX) may have made an important top on October 11, 2024.
The Fibonacci sequence is as follows, (1, 1, 2, 3, 5, 8, 13, 21, 34, 55, 89, 144, – – to infinity).
The prior blog “October Eleventh Connection” noted a SPX Fibonacci time relationship that began in October 1990. The monthly SPX chart courtesy of Trading View illustrates that relationship.
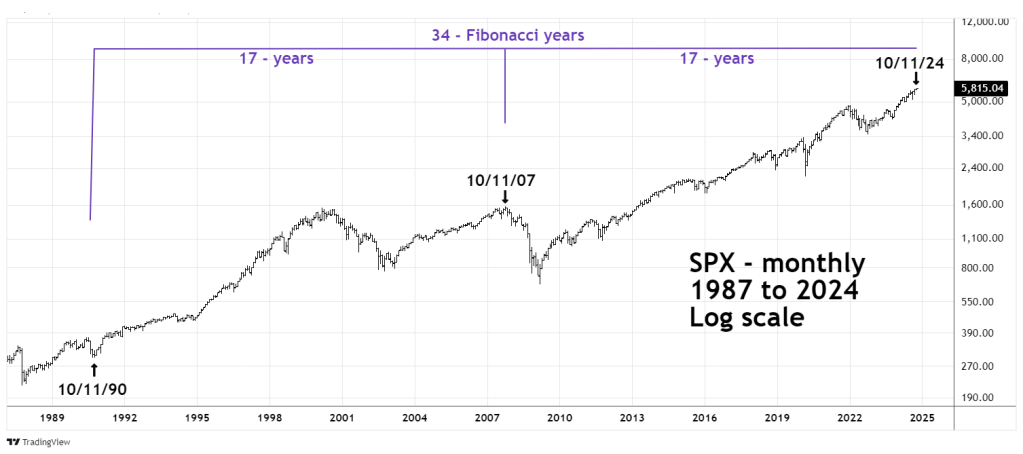
The potential 34 – year cycle begins on 10/11/90 with a bisecting point at the SPX major top on 10/11/07.
The daily SPX chart shows the beginning of the cycle in 1990.
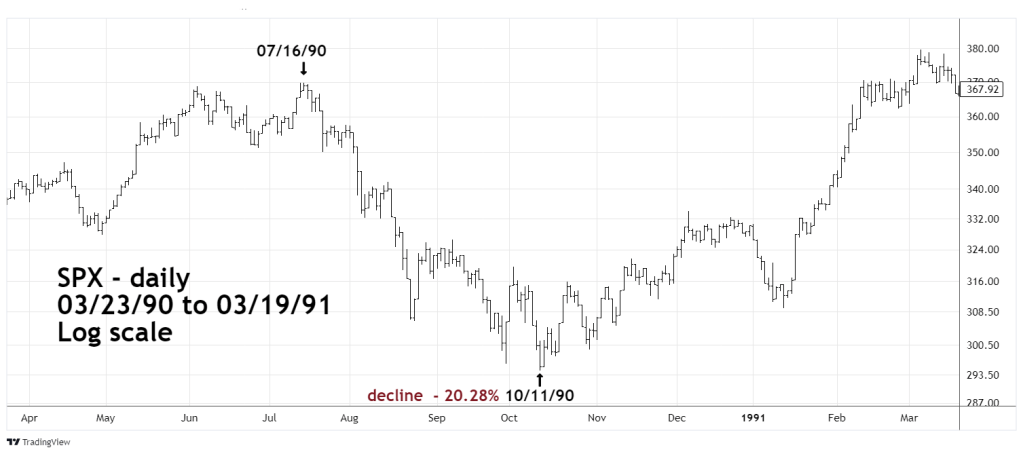
A three-month bear move began on 07/16/90 and ended 10/11/90. July 16th should be familiar. In 2024 just prior to the early August mini- crash the SPX made an intermediate peak on July 16th.
The next daily SPX chart examines the start of a 5 – year bull market that ended on 10/11/07.
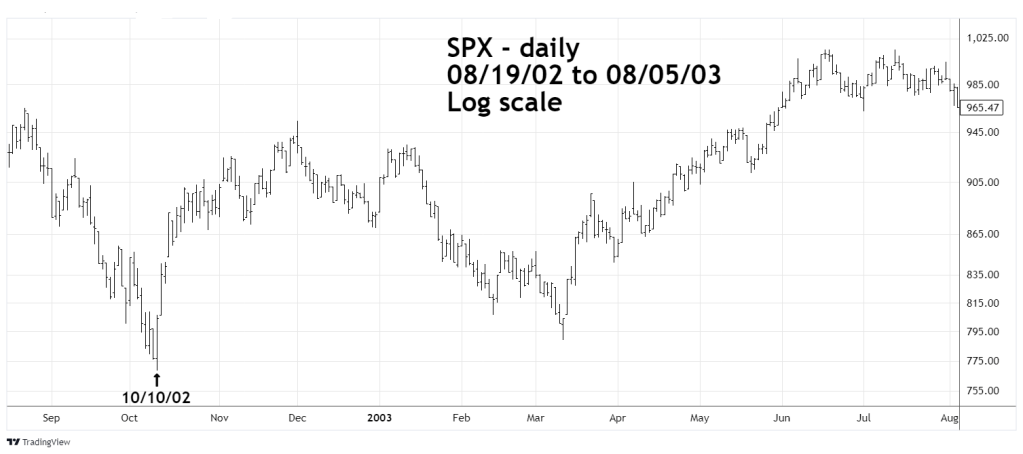
The bull market began on 10/10/02 and lasted almost exactly 5 – years. When measuring yearly Fibonacci time relationships they are rounded to the year. For example, a movement that lasted 5 – years and 4 – months would be rounded to 5 -years. It’s very rare for a yearly time relationship to be exact.
The next daily SPX chart illustrates the birth of the current bull market in October 2022.
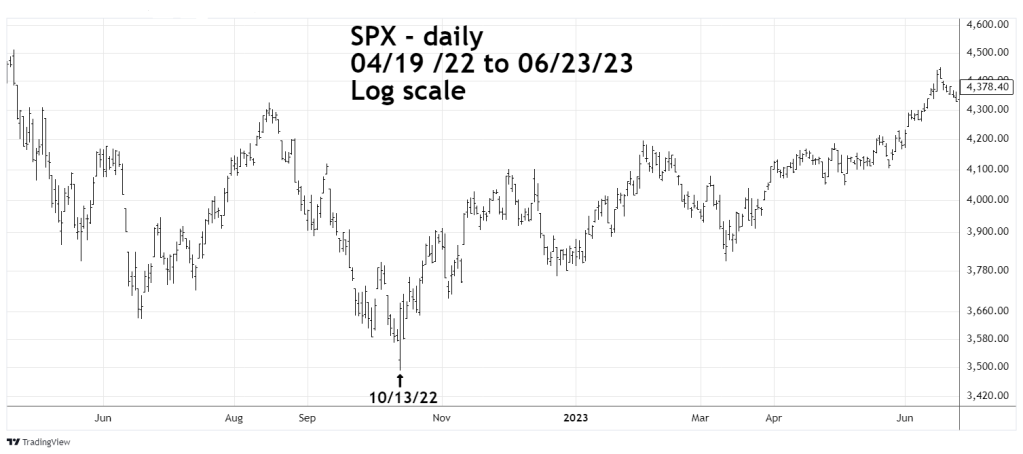
The bull market began on 10/13/22. If the SPX makes its ultimate bull market top on 10/11/24 or a few trading days after, it would be almost exactly 2 – years.
A summary of the Fibonacci time relationships is as follows.
The entire cycle spans 34 – Fibonacci years.
The SPX October 2007 top is a Fibonacci ratio of .50 (1990 to 2024).
The SPX July to October 1990 bear market was 3 – Fibonacci months.
The SPX 2002 to 2007 bull market was 5 – Fibonacci years.
The bull market that began in 2022 could potentially be 2 – Fibonacci years.
Potential Fibonacci time cycle turns need to be supported by sentiment and momentum evidence. This websites next blog will examine that evidence.
