Yields for the 30 – Year U.S. Treasury Bond (TYX) have moved above important chart resistance and could be poised to move higher.
The 09/25/24 blog “Rising U.S. Interest Rates – 09/25/24” illustrated that the next TYX resistance point was the 09/03/24 peak at 4.206. Subsequently TYX has moved above that point and has reached the Fibonacci .382 retracement of the April 2024 to September decline.
The daily TYX chart courtesy of Trading View updates the action.
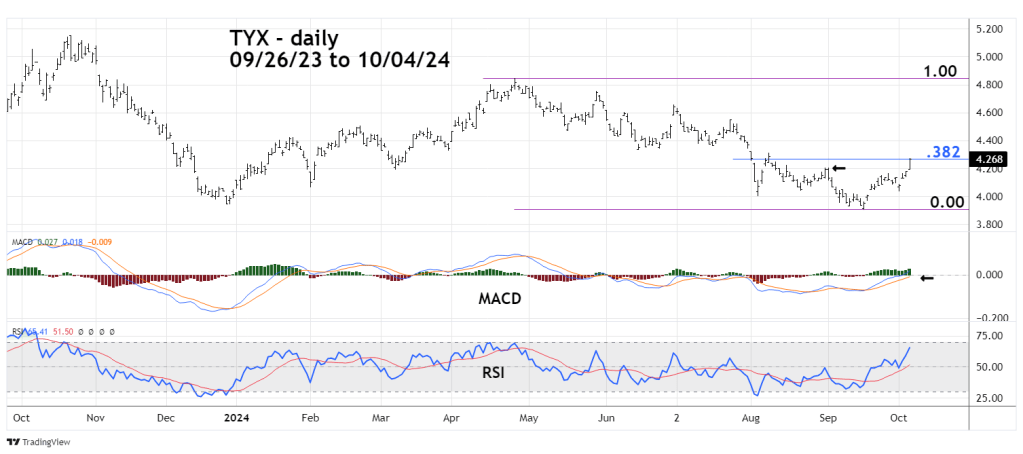
Just above the Fibonacci .382 resistance is chart resistance at the 08/08/24 peak at 4.314. A move above this resistance zone could open the door for a rally to the 07/24/24 peak at 4.552.
Daily RSI has not reached the overbought zone which begins at 70.00. The MACD lower line is still below the “zero” level.
Please note that on 10/04/24 TYX had a large spike up. It’s possible TYX could be in the middle of a powerful third wave up from the bottom made on 09/17/24. If so there could be another large move up on 10/07/24.
The next daily chart compares TYX to the yield on the 10 – Year U.S. Treasury Note (TNX) and the 5 – Year U.S. Treasury Note yield (FVX).

TNX and FVX are also in rising trends and are poise to move above chart resistance at their respective 08/08/24 peaks.
Most traders and financial analysts are focused on how much the U.S. – FOMC will cut short term rates. They should be concerned about how high long -term interest rates could rise.
