The S&P 500 (SPX) may have completed an extended Elliott five wave pattern from the October 2022 bottom.
The weekly SPX chart courtesy of Trading View updates the action.
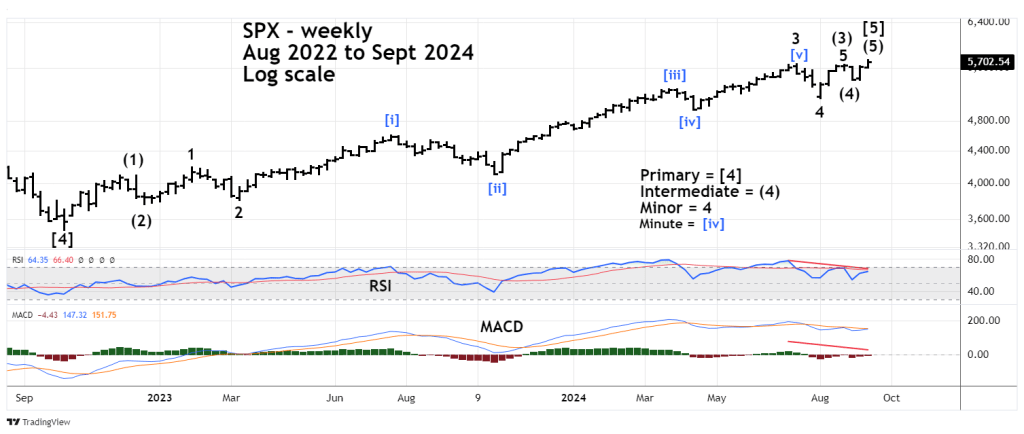
The move up from October 2022 to January 2023 is a series of one’s and two’s which is the basing pattern for a long and powerful third wave.
Typically, the third wave has a clear five wave subdivision, which in this case it does. Please note the mid portion of Minor wave “3” labeled Minute wave [iii] is the longest and steadiest rally of the entire October 2022 to September 2024 bull market. This is typical third of a third wave action – powerful with little or no corrections.
The final portion of the structure begins in July 2024 with a series of four’s and five’s. This action corresponds to the series of one’s and two’s from October 2022 to January 2023.
The September 2024 top has significant RSI and MACD bearish divergence vs. the July 2024 peak.
If the extended five wave pattern from October 2022 to September 2024 is complete it implies a down move corresponding to size of the bull market. The rally lasted almost two years and implies the next bear market could last several months. Retracement of the nearly two-year rally could range from a Fibonacci .382 to .618.
If a subsequent bear market were to break below the October 2022 bottom it could mean a multi-year bear market in development.
The five – minute SPX chart illustrate a very clear short-term Elliott wave pattern.

The move down from the 09/19/24 top is a clear Elliott Impulse wave followed by a clear three wave correction. If on 09/23/24 the SPX does not exceed it 09/19/24 top, a move below the 05/20/24 bottom could be an important signal. The level is 5,674.49 labeled Minuette wave ( i ). A move below this bottom could open the door for a move down to the 09/18/24 bottom at 5,615.08. A break below the 09/18/24 bottom could be a very bearish signal.
The Russell 2000 (RUT) – small cap stocks continues to lag the three main U.S. stock indices in upside performance. There’s a high probability that in the next bear market RUT could lead the way down.
At the open of the main U.S. trading session 9:30 AM – EDT – 09/23/24 traders short 100% Russell 2000 non-leveraged funds. Use a move above RUT 2,280 as a stop loss for half the position. Use a move above RUT 2,320 as a stop loss for the other half of the position.
