After almost a year of anticipation the U.S. FOMC lowered short-term interest rates by a half of a percent. Happy days are here again! Are they? From just before the announcement longer – term U.S. interest rates have been rising. If the trend continues it could be detrimental to the U.S. economy.
The weekly chart of the CBOE 30 – Year Treasury Bond Yield (TYX) courtesy of Trading View illustrates its long-term Elliott wave count.
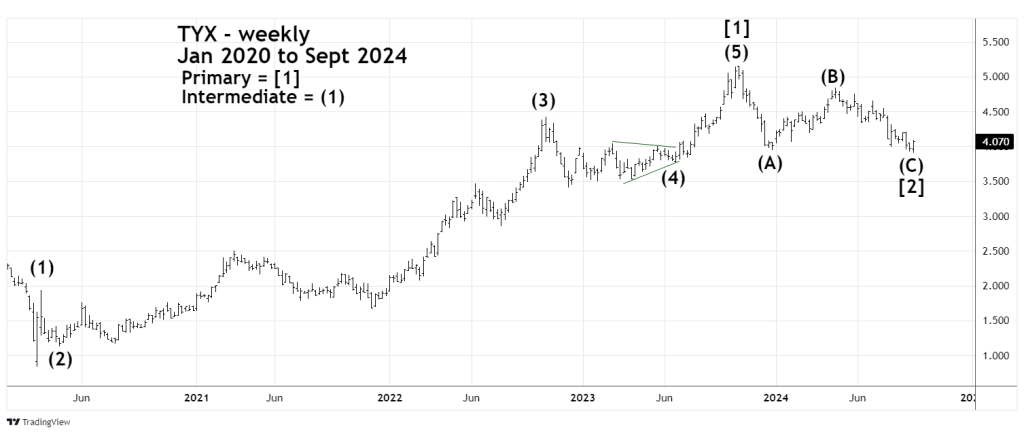
From the major bottom formed in March 2020 to the peak made in October 2023 TYX formed a very clear Elliott extended Impulse wave. The Decline from October 2023 to September 2024 is a clear Elliott wave Single Zigzag correction. In almost all instances of Single Zigzags wave “C” exceeds the termination point of wave “A”. Which in the presumed Single Zigzag from October 2023 to September 2024 has occurred.
The daily TYX chart illustrates momentum.
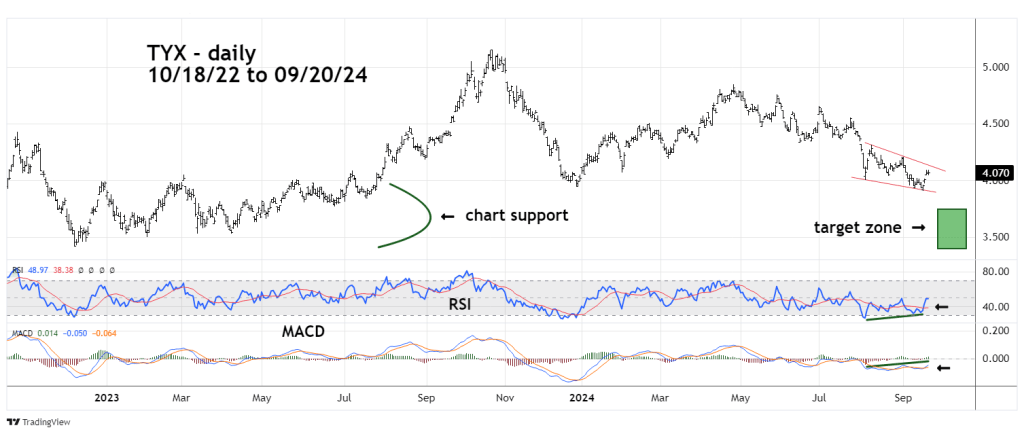
The 09/06/24 blog “U.S. 30 – Year Treasury Yield Update – 09/06/24” illustrated a potential TYX support zone in the area of 3.40 to 3.70. A main factor in determining this zone was the choppy trading range that occurred from late 2022 to June 2023. The September 2024 bottom is in the area of top of the choppy trading range. In particular the peaks made in December 2022. February 2023, and May 2023..
Please note that the TYX bottom came on 09/17/24 one day before the FOMC announcement.
Daily RSI and MACD have bullish divergences. RSI has crossed above its moving average line and MACD has a bullish lines cross. The next bullish signal to watch for is a move above the declining trendline connecting the tops made on 08/08/24 and 09/03/24.
The next daily chart shows the CBOE 10 – Year Treasury Note Yield (TNX).
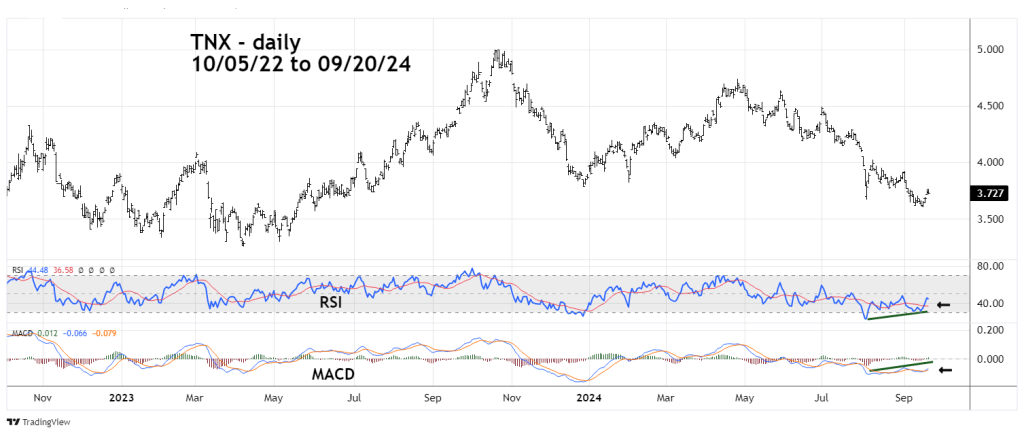
The TNX daily RSI and MACD also have bullish divergences. Both have bullish line crosses.
The next daily chart examines the 5 – Year Treasury Yield.
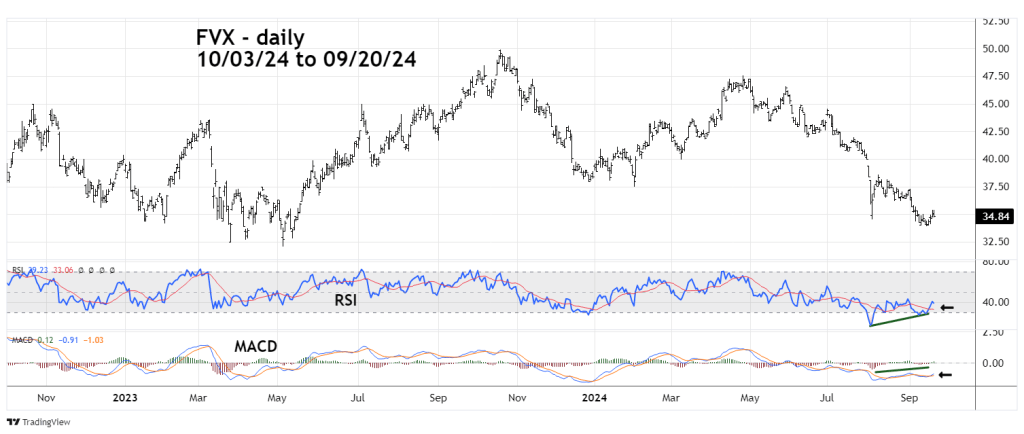
Again, bullish signals from the daily RSI and MACD.
If the TYX long – term Elliott Wave count is correct it could be in the early part of Primary wave [3] which could far exceed the top made in October 2023. If this scenario occurs the TNX and FVX could also move far above their respective 2023 peaks.
One area in particular that could be hurt by rising long-term interest rates is the U.S. housing market. Mortgage rates are based on the action of 10 – year interest rates. The U.S. FOMC controls short-term interest rates, not long-term rates.
Currently most U.S. stock and bond traders are doing the “bull dance” in anticipation of more short-term rate cuts later in 2024. Even if these rate cuts happen it may not be bullish for U.S. bonds and stocks.
