The 08/29/24 blog “Dow Jones Industrial Average – Long – Term Elliott Wave Count – 08/29/24” illustrated the Dow Jones Industrial Average (DJI) was approaching a rising trendline connecting the December 2022 and July 2024 peaks. On 08/30/24 the DJI came closer to the trendline when it made another new all-time high. There’s also a shorter term trendline that could signal a significant top.
The daily DJI chart courtesy of Trading View updates the action from the major bottom made in October 2022.

R.N. Elliott discovered that sometimes the termination points of the first, third, and fifth waves of Motive patterns are connected by a trendline.
The DJI Log scale chart shows that the presumed Intermediate wave (5) which began on 08/05/24 could touch the trendline near DJI 42,000. Occasionally with rising trendlines price could terminate marginally above or below the trendline.
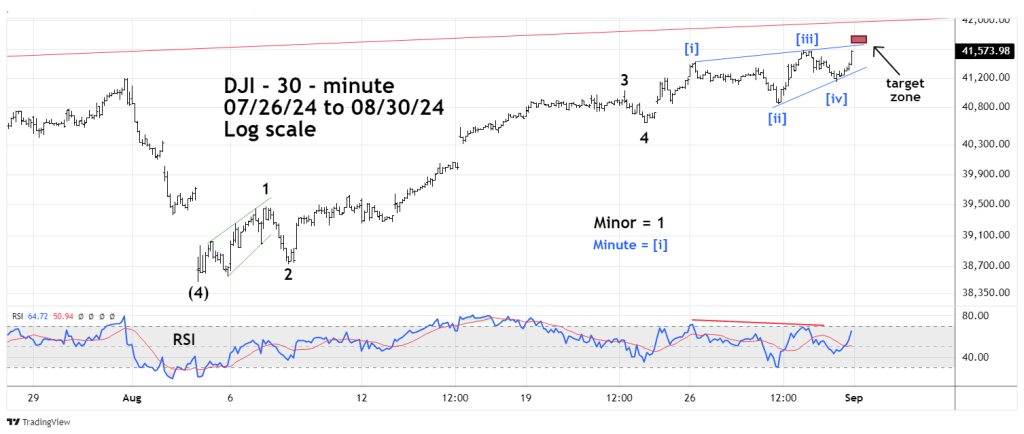
The DJI – 30 – minute chart illustrates why the post 08/05/24 rally could peak just below the rising long – term trendline.
In Elliott wave theory Motive waves subdivide into five waves and always move in the same direction as the trend of one larger degree.
Within Motive waves there are three sub types.
Impulse.
Leading Diagonal Triangle.
Ending Diagonal Triangle.
The post 08/05/24 rally is an Impulse wave, in this case the presumed developing Intermediate wave (5).
Within Intermediate wave (5) Minor wave “1” is a Leading Diagonal Triangle.
The presumed Minor wave “5” which began on 08/22/24 is an Ending Diagonal Triangle (EDT). They form a wedge shape pattern and are the termination of larger movements, in this case the post 08/05/24 rally.
In Elliott wave rules the third wave of a Motive pattern can never be the shortest of the three sub-Motive waves.
Minute wave [ i ] is 835.58 points.
Minute wave [ iii ] is 735.68 points.
The Minute wave [ iv ] bottom is 41,145.85 adding 735.67 equals 41,881.52, this is the maximum point for the presumed Minute wave [ v ]. A move above this level invalidates the EDT wave count.
Frequently within Motive waves there’s a Fibonacci relationship between sub waves “one” and “five”.
In this case Minute wave [ i ] 835.58 times the Fibonacci ratio of .618 equals 516.58, added to the Minute wave [ iv ] bottom of 41,145.85 targets DJI 41,662.23 as the termination point for Minute wave [ v ] of Minor wave “5” of Intermediate wave (5).
Frequently the fifth wave of an EDT will briefly throw over the trendline connecting the termination points of the first and third wave. If the target price of 41,662.23 is hit early in the 09/03/24 main session there could be a brief throw over.
This websites next blog will illustrate some mind boggling DJI – Fibonacci price and time relationships.
