On 08/29/24 the Dow Jones Industrial Average (DJI) made another new all-time high unconfirmed by the S&P 500 and the Nasdaq Composite. The DJI may have also completed an Elliott wave – extended Impulse pattern from the October 2022 bottom.
The daily DJI chart courtesy of Trading View illustrates the long – term Elliott wave count.
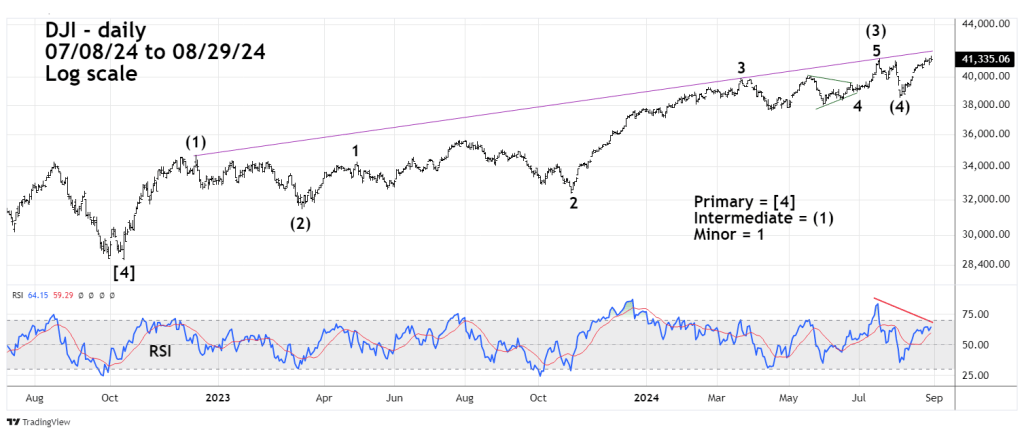
The bearish evidence supporting the theory of a top as of 08/29/24 is the significant RSI bearish divergence vs. the DJI 07/18/24 peak.
On the bullish side of the coin, it’s possible the DJI could continue to rally and touch the rising trendline connecting the December 2022 and July 2024 peaks.
The 30 – minute September 2024 – S&P E-Mini – Point & Figure (ESU 2024) chart courtesy of Ninja Trader shows what could be very important support.
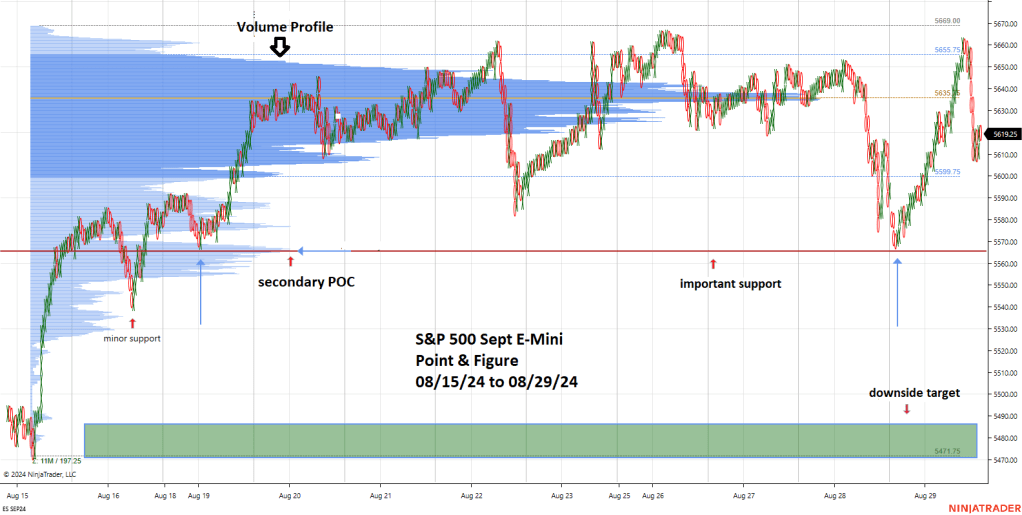
After the main trading session on 08/28/24 – ESU 2024 – Point & Figure chart reached the same level made on 08/19/24. This support level corresponds with a secondary Point of Control (POC) support area. In Volume Profile analysis wide volume zones are potential support/resistance.
If ESU 2024 breaks below the 08/28/24 bottom there’s only minor support at the 08/16/24 low. The next significant support is in the 5,470 to 5,485 area.
A break below the 08/28/24 bottom could trigger a one to two day drop of 100 ESU 2024 – points.
