Seasonally U.S. stocks can decline from May until October. Sometimes during persistent bull trends U.S. stocks could peak in late August or early September. Examples of this phenomenon occurred in September 1929, August 1987 and September 2000. A recent bearish momentum divergence could be signaling a sharp August to October 2024 stock decline.
The daily Dow Jones Industrial Average (DJI) courtesy of Trading View illustrates a broad momentum bearish divergence.
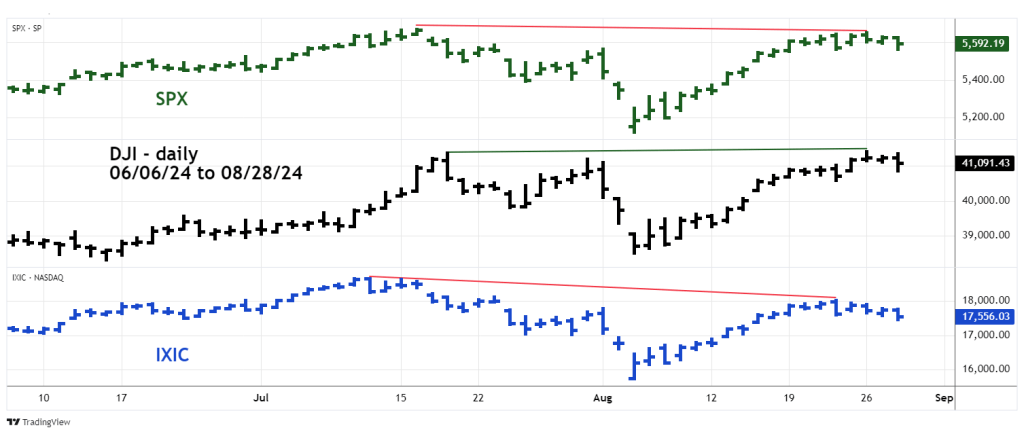
When only one of the three main U.S. stock indices, DJI, S&P 500 (SPX) and Nasdaq Composite (IXIC) makes a new high/low unaccompanied by the other two main indices it’s what I call a “Rule of the majority” signal. The truth is with the two non-conforming indexes.
This phenomenon happened at the major tops made in 2000, 2007, and 2022. During 2024 there have been several “Rule of the majority” signals, all of which have been overcome by the persistent rally.
The 08/26/24 signal happened during a prime bearish time zone.
The 15 – minute DJI chart zooms in on the intraday action.

The DJI movement from the 08/26/24 peak could be an Elliott wave series of “one’s” and “two’s” which in a down trend is a very bearish configuration. A move below DJI 40,842.29 could trigger a sharp drop.
