The near vertical rally of the S&P 500 (SPX) continues.
The one – hour SPX chart courtesy of Trading View updates the action.
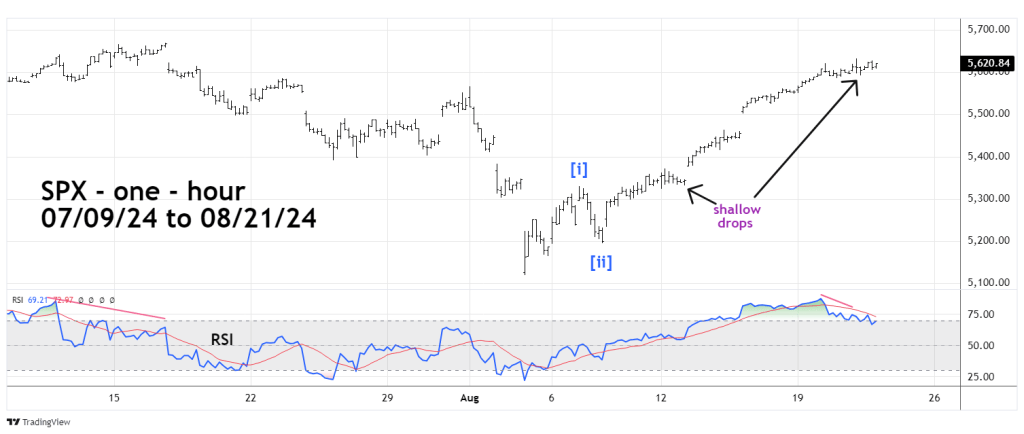
The only significant change on an hourly basis is the RSI significant bearish divergence AT THE 08/21/24 peak.
The big problem from an Elliott wave perspective are the very shallow declines, in particular the mini drops of the prior two trading days. It’s possible one of these shallow declines is wave [iv] of a developing five-wave Impulse pattern.
More likely the shallow drops a part of a still developing wave [iii] of a five wave move up from the 08/05/24 bottom.
At the SPX 08/21/24 high it had retraced 93% of the July to August minicrash. A new SPX all-time high could be made in the next one or two trading days.
