The S&P 500 is pushing through chart resistance in the low 5,500 area and short -term momentum is still bullish. Short – Term Elliott wave analysis could provide a road map to near -term action.
The one- hour SPX chart courtesy of Trading View updates short-term momentum.
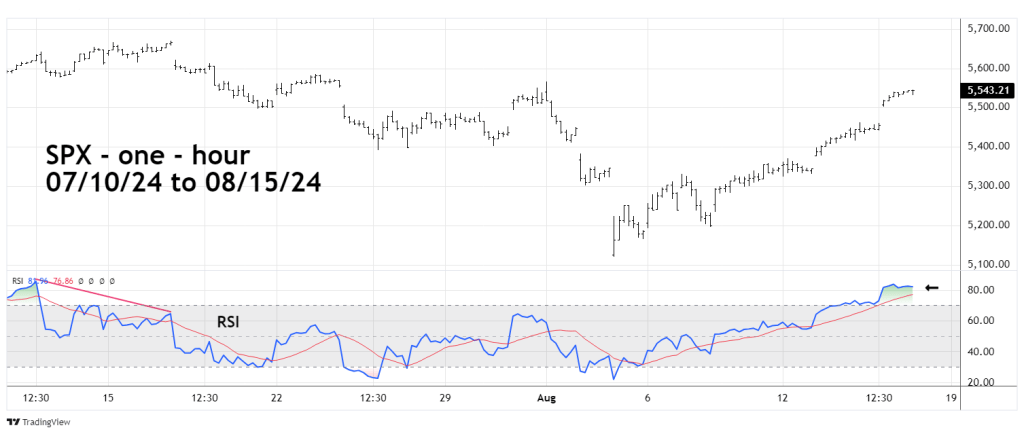
On 08/15/24 the one – hour RSI pushed deeper into the overbought zone which begins at 70.00. For stock indices RSI movements into the overbought zone almost always have at least one bearish divergence before price peaks. At the SPX high on 08/15/24 there was only a very small bearish divergence. Please note the significant RSI bearish divergence at the 07/16/24 top.
The most likely scenario is for the SPX to have a small one-day decline followed by a rally above the SPX 08/15/24 high.
The 15 – minute SPX chart shows the Elliott wave count from the 07/16/24 top.
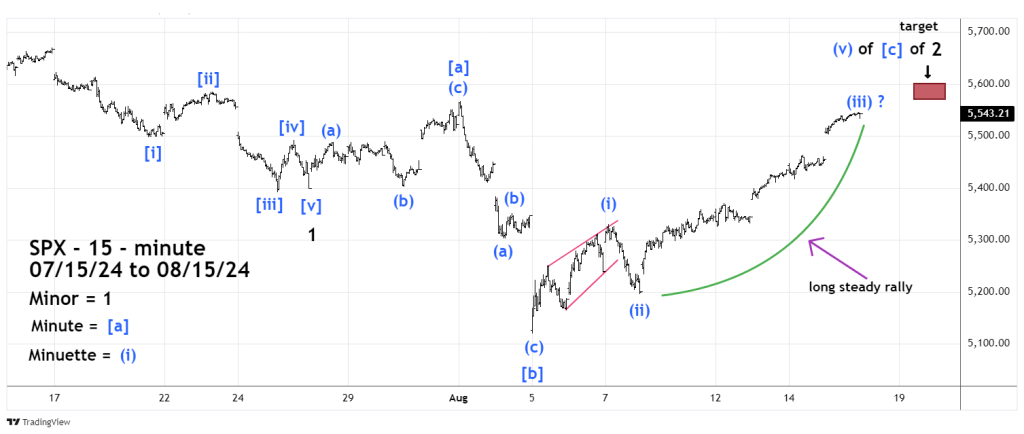
The Impulse wave down into the 07/25/24 bottom – labeled Minor wave “1” looks like it could be corrected by an Elliott wave – Expanding Flat correction. In this case because its correcting downward progress its referred to as an Inverse Expanding Flat.
Expanding Flats are composed of three sub waves. The first sub wave further subdivides into three waves. The second wave also sub divides into three waves and exceeds the point of origin of the first sub wave. The third sub wave divides into five waves and exceeds the point of origin of the second sub wave.
The rally after the 08/05/24 bottom – labeled Minute wave [b] appears to be a developing five – wave impulse pattern. The first wave of this structure – Minuette wave ( i ) is a Leading Diagonal Triangle. Minute wave ( ii ) retraced a Fibonacci .618 of the first wave which is a typical retracement for wave “two”. The subsequent rally is long and steady, which is what you would expect in an extended third wave.
After completion of Minuette wave (iii ) the next expected move would be a shallow decline followed by a rally. The presumed Minuette wave ( v ) would need to marginally exceed the SPX high made on 08/01/24 at 5,566.16 – Minute wave [a]. The broad target zone is 5,566.17 to about 5,600.00
The peak of the presumed Minor wave “2” top could come on 08/19/24 which is a Full Moon day.
A side note – the SPX – 1987 bull market top was on August 25th. What followed was the August to October 1987 stock market crash.
