The 08/10/24 blog “S&P 500 – Short – Term Resistance” illustrated strong resistance in the S&P 500 (SPX) area of 5,390 to 5,397. Also noted “A move above 5,400 could quickly propel the SPX up to the low 5,500 area”.
On 08/13/24 the SPX did move above 5,400 and is now close to the next potential resistance in the low 5,500 area.
The daily SPX chart courtesy of BigCharts.com updates short – term momentum.

Daily Slow Stochastic lines have reached the overbought zone above 80.00 indicating a short – term top could be made in one or two trading days.
MACD has bullish lines cross over. If a short-term peak does not occur in the low 5,500 area the SPX could reach the July top in about one or two weeks.
If the SPX makes a short-term top on 08/15/24 or 08/15/24, MACD may indicate a bullish move after a near -term decline. The potential second bull phase may continue into mid – September 2024, just prior to the U.S. FOMC interest rate decision.
The one – hour SPX chart courtesy of Trading View illustrates intraday momentum.
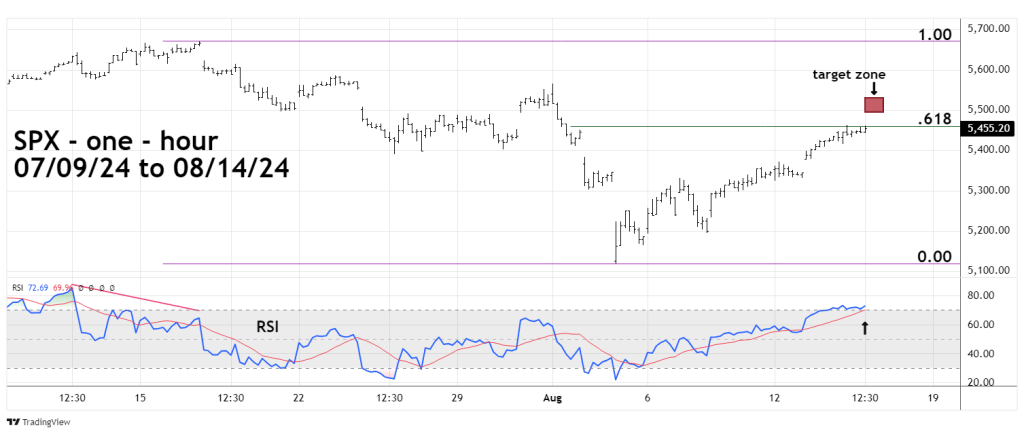
The SPX has marginally moved above a Fibonacci .618 retracement of the July to August decline. One hour – RSI implies this potential barrier could also be exceeded. RSI has reached the overbought zone above 70.00. For stock indices when RSI reaches overbought there’s almost always at least one bearish divergence before price peaks.
There’s a good chance SPX could continue to rally into the low 5,500 target zone.
Most likely scenario, SPX rises into chart resistance in the low 5,500 area, followed by a one- or two-week decline. A possible second rally could terminate mid – September just prior to the U.S. FOMC interest rate decision.
