Long – term S&P 500 (SPX) price patterns could provide clues to the direction of U.S. stocks in the second half of 2024.
The 07/20/24 blog “Examination of S&P 500 – July Tops” looked at seven examples of what happened with the SPX after significant July peaks. Two of the examples, post July 2011 and post July 2015 could provide templates of what may happen in late 2024.
The first example is a daily SPX chart courtesy of Trading View showing what happened in 2011.

After the July 2011 peak there was an 18.7% drop into a bottom made on 08/09/11. Please note that most of the decline occurred in August during a seven-day mini crash. Subsequently there was a choppy rally followed by a final decline into a seasonal October bottom.
The next SPX chart illustrates the action – 2015 to 2016.
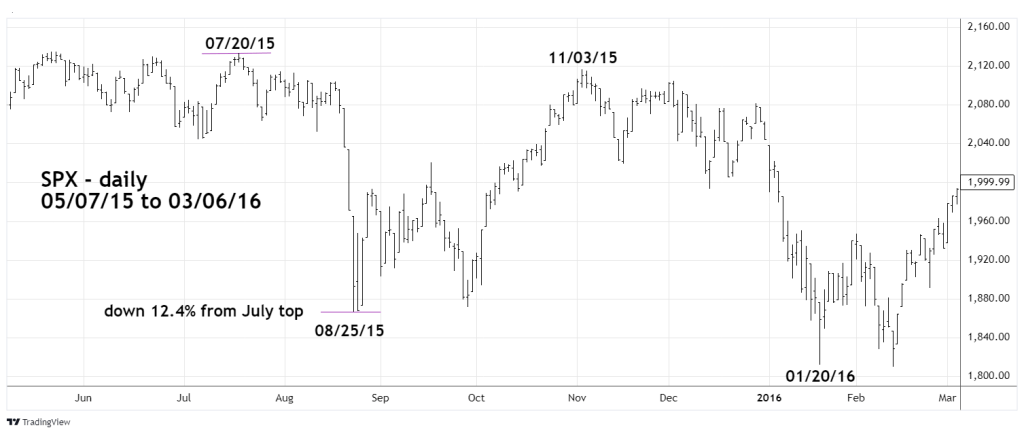
In this case the July to August fall was 12.4%. Again, note that most of this move was made during an August mini crash. Afterwards there was a choppy rally into mid – September. There was a truncated seasonal decline into late September. A secondary bottom was made in late September not October. After the late October peak there was another unusual move. Seasonally November through December is bullish for U.S. stocks, during late 2015 the bears were in control.
The next daily SPX chart shows a forecast for the second half of 2024 based on an educated guess – time travel was not involved.
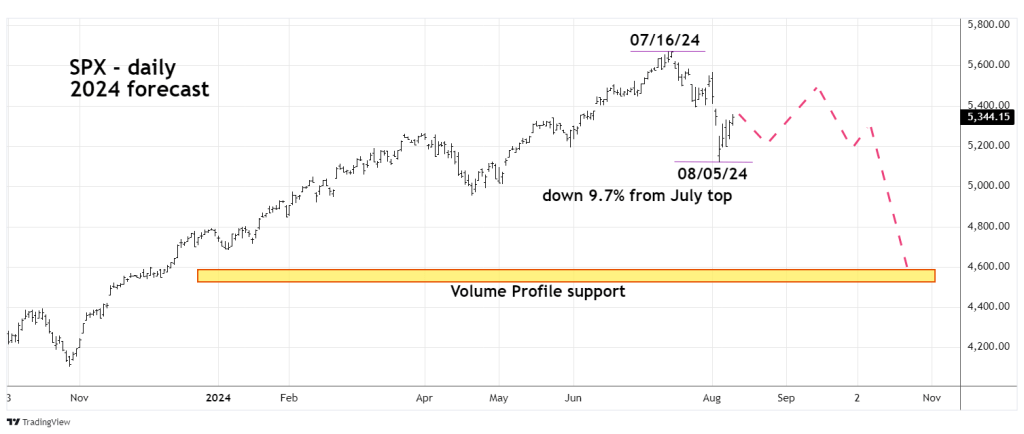
Just like in 2011 and 2015 there’s been a mini crash in August. The gigantic VIX spike up at the SPX bottom on 08/05/24 strongly implies this low could hold for several weeks. Please see the 08/08/24 blog “Huge VIX Spike Up – August 2024”.
Typically, after a crash or mini crash there’s a choppy rally – again note the rallies after the 2011 and 2015 August drops.
If the subsequent rally fails, the maximum upside potential could be near the late July early August secondary top.
In the 07/20/24 blog illustrations, four of the five post July declines made their ultimate bottoms in October. Probabilities suggest a 2024 bear move could terminate in October. Possible major support comes from Volume Profile analysis. Please see the 08/07/24 blog “Support Areas for the S&P 500 – August 2024”.
A possible mid-September 2024 rally peak is based on the next U.S. FOMC interest rate decision due on 09/18/24.
Since November 2023 the narrative from the Financial media has been that U.S. stocks were rising in expectations of interest rate cuts – probably three, sometime in 2024. Amazingly, from January to July 2024 U.S. stocks rallied and there have been no rate cuts!
In July 2024 after reports suggested a weakening U.S. economy the narrative changed to – a rate cut means recession and bearish for stocks. Then there was a mini crash.
The news narrative now is that on 09/18/24 the FOMC needs to cut interest rates 50 – basis points, not the previously expected 25 – basis points.
This could be a classic case of buy the rumor sell the fact. The big question is how much of an expected rate cut is factored into stock prices?
We could have an answer after the 09/18/24 – U.S. FOMC announcement.
