Recent sentiment and momentum evidence suggest the S&P 500 (SPX) could rally into mid – September 2024. Fibonacci analysis indicates an important barrier the bulls need to overcome.
First a look at short -term momentum. The daily SPX chart courtesy of BigCharts.com illustrates some interesting clues.
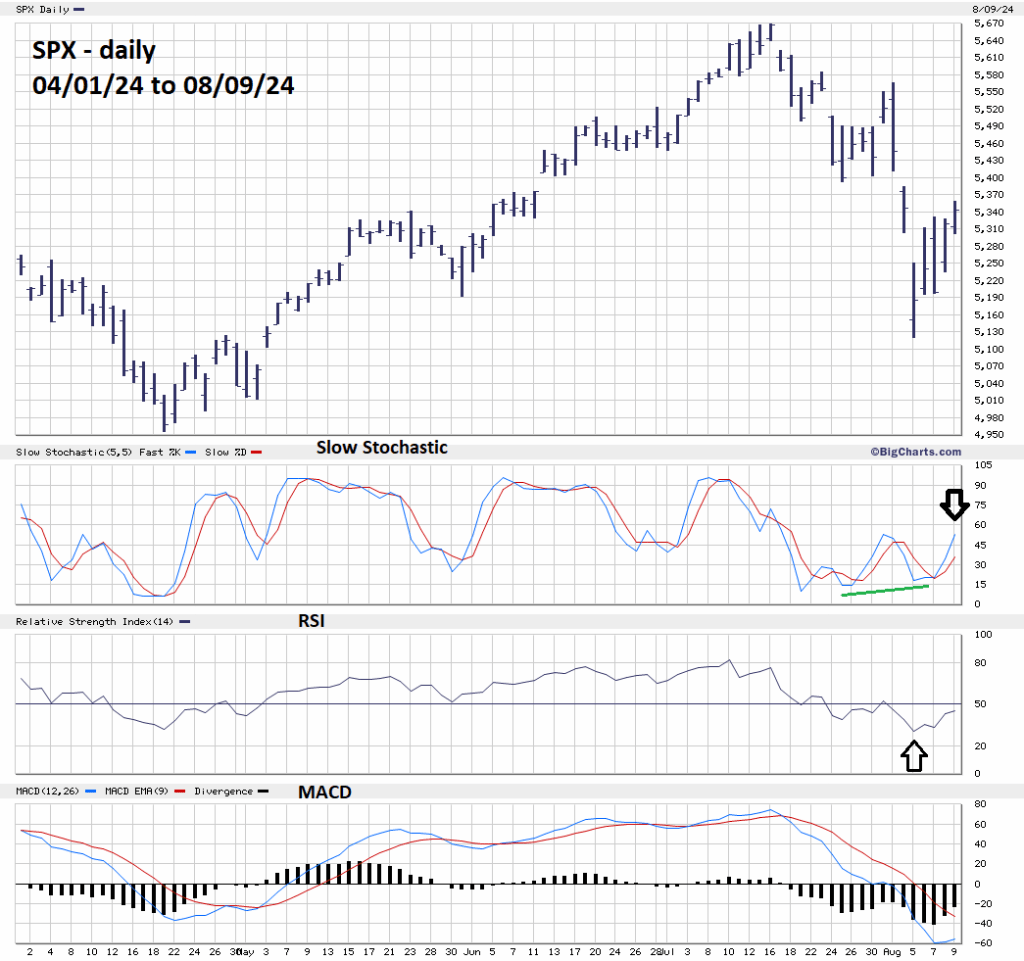
The BigCharts.com Slow Stochastic is very effective in catching turns. Sometimes it can be used to estimate the length of a price movement.
Think of the Slow Stochastic as a fuel gauge indicating how much further price could travel. As of 08/09/24 the lower line has just crossed 30.00 and the upper line is near 50.00. Both have a while to go before reaching the overbought zone which begins at 80.00.
Of course, a top could still be nearby. Please note that the Slow Stochastic reading at the most recent peak made on 08/01/24 were almost at the same level. The difference this time is a more significant Slow Stochastic bullish divergence at the 08/05/24 bottom and the RSI reading of 30.00 – the boundary of its oversold zone.
There’s also the huge VIX spike made on 08/05/24. Please see the most recent blog” Huge VIX Spike Up – August 2024”.
Both sentiment and momentum evidence indicate the SPX could rally for at least a few weeks. The potential move up could be choppy.
The hourly SPX chart courtesy of Trading View shows some fascinating Fibonacci price relationships.
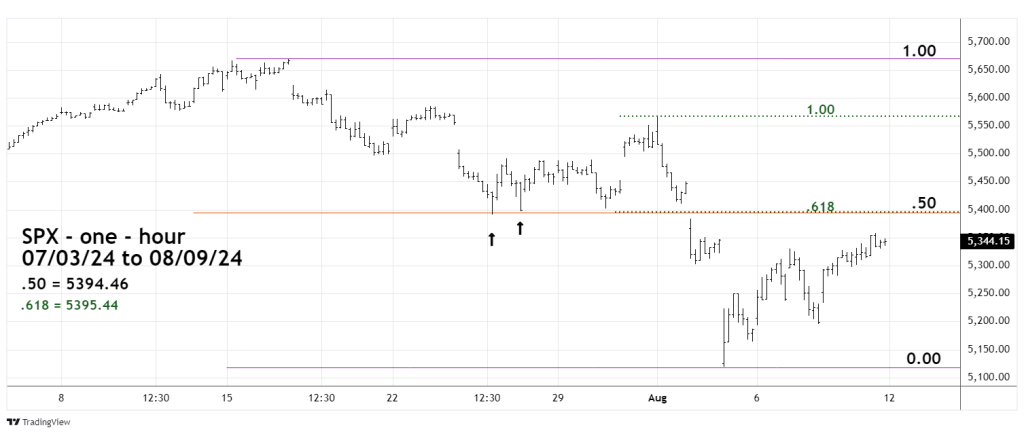
A Fibonacci .50 retracement of the 07/16/24 to 08/05/24 move is at 5,394.46.
A Fibonacci .618 retracement of the 08/01/24 to 08/05/24 move is at 5,395.44.
When two or more Fibonacci coordinates are very close it implies very strong support/resistance.
Sometimes prior bottoms can later become resistance. The two Fibonacci coordinates are bracketed by two short term bottoms made on 07/25/24.
The first bottom is at 5,390.95.
The second bottom is at 5.397.65
To break through powerful resistance/support requires powerful force.
A move above 5,400 could quickly propel the SPX up to the low 5,500 area.
A short-term SPX peak may be in place as of 08/09/24. If not an SPX move up to the 5,390 area on 08/12/24 could meet a ceiling.
