Volume Profile analysis indicates where the S&P 500 could find support during the month of August 2024.
Volume Profile puts market volume on a vertical axis which illustrate where volume is relative to price. The wider the volume bar the greater the potential support/resistance. The widest volume bar is called “Point of Control” (POC).
The daily E-Mini S&P 500 (ES1!) chart courtesy of Trading View shows the action since the October 2023 bottom.
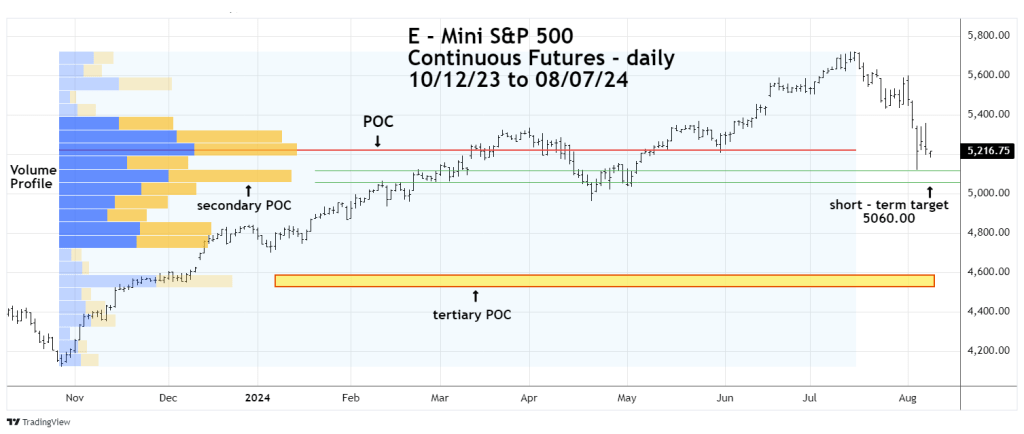
On 08/05/24 there was a break below POC which implies more downside action.
Note that the 08/05/24 move down stopped at the upper boundary of the secondary POC zone. It appears that the bounce off that support may have ended and could find support at the lower boundary of secondary POC.
Daily RSI supports this theory because it reached the edge of the oversold zone at 30.00 on 08/05/24.
If the secondary POC level is broken the S&P 500 – next significant support is the sideways correction made late December 2023.
It’s possible the S&P 500 could make it to this support area – a 19 to 20% decline from the July 2024 top sometime in August 2024.
Please see the 07/20/24 blog “Examination of S&P 500 – July Tops”.
