Yield/rate for U.S. 30 – Year Treasury bonds could make an important bottom late August to early September 2024.
The 02/01/24 blog “U.S. 30 – Year Treasury Yield – Elliott Wave Count – 02/01/24” illustrated that a short-term rally of U.S. 30 – year Treasury yield (TYX) could be complete, and the next phase down could be underway. The short-term rally which peaked on 01/25/24 was not complete.
The weekly TYX chart courtesy of Trading View updates the long – term Elliott wave count.

The TYX bull move from 2020 to 2023 was a textbook extended Elliott wave Impulse pattern. After completion of the three-year rally, the most likely scenario would be a multi-month decline back at least the area of the fourth wave of the next lower degree. In this case it’s the choppy sideways movement from October 2022 to June 2023 labeled Intermediate wave (4).
The sideways movement is also near a Fibonacci .382 retracement of the 2020 to 2023 rally.
Please note the recent decline has brought the weekly Stochastic to edge of the oversold zone which starts at 20.00. If TYX declines in the next few weeks its likely to bring the Stochastic lines deep into the oversold zone.
The daily TYX chart focuses on the shorter-term action.
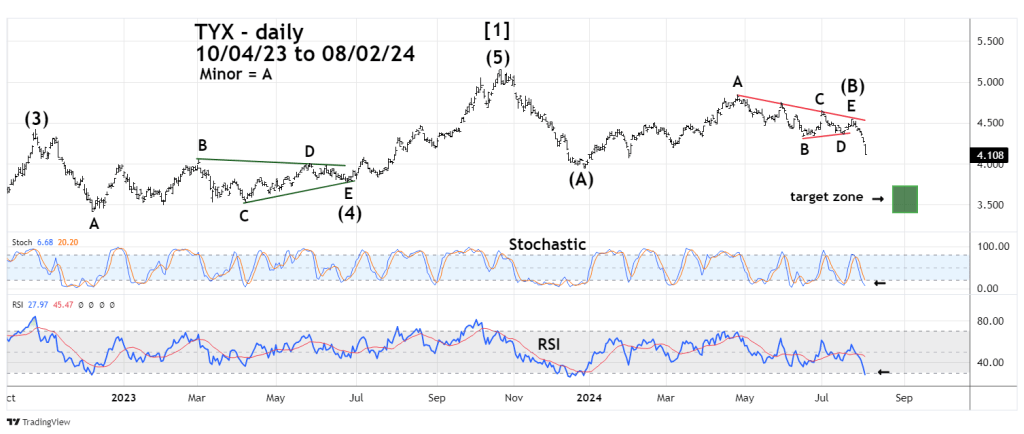
The TYX October 2022 to June 2023 movement is an Elliott wave – Horizontal Triangle. This structure only appears in the fourth wave position of motive patterns and in the wave “B” position of corrective patterns.
The movement from 12/27/23 to 07/24/24 also appears to be a Horizontal Triangle. When correcting downside progress they are referred to as an Inverse Horizontal Triangle.
After completion of a Horizontal or Inverse Horizontal Triangle there’s usually a thrust in the direction of the main trend. In this case down. Daily Stochastic and RSI have reached their respective oversold zones which implies at least a short-term bounce could come soon.
If after a bounce the down trend continues, it could last until late August or early September 2024.
The broad price target for a bottom is the 3.40 to 3.70 area.
