The easiest way to understand Elliott wave theory is to view markets or stocks in segments. Currently the most important S&P 500 (SPX) segment is the 04/19/24 to 07/16/24 rally. The consequences of the recent decline could provide directional clues for the remainder of 2024.
The daily SPX chart courtesy of Trading View illustrates the most recent action.
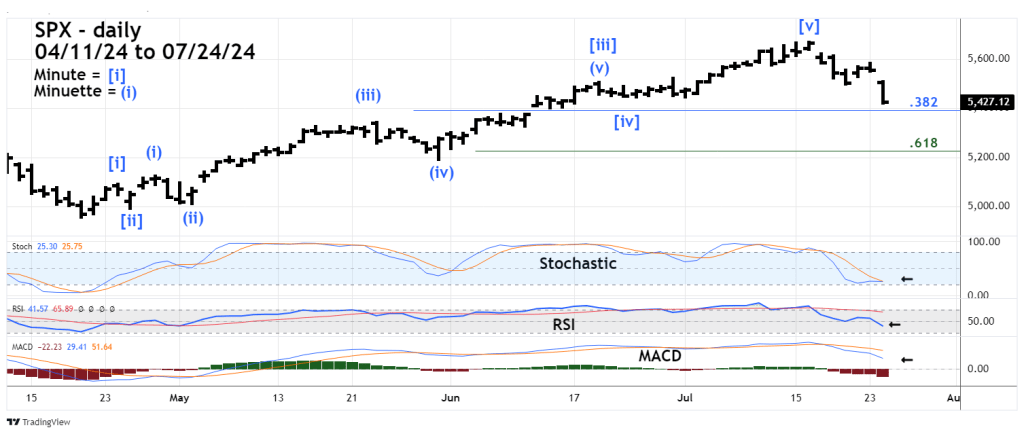
The SPX move from 04/19/24 to 07/16/24 is a clear extended Elliott wave Impulse pattern. The big question, is this movement the final wave up of a bull market or the first wave up of a still developing larger rally?
Evidence from momentum indicators implies more downside action. Daily Stochastic is just above the oversold zone which begins at 20.00. In extended down moves, daily SPX Stochastic could remain oversold for a week or longer. RSI has only reached 41.57, its oversold zone begins at 30.00. MACD lines are above the “zero” level.
At the very least it appears the SPX could decline for another five to seven trading days.
The two most important retracement levels are 5,400, and 5,230. The 5,400 level is near a Fibonacci .382 retracement of the April to July rally. Current momentum reading suggest the potential support level could be broken.
A more likely area for a bottom to develop is near 5,230 which is a Fibonacci .618 retracement of the April to July rally.
A move below chart support at 5,191.68 could open the door for a move back to the 04/19/24 bottom.
The low of 4,953.56 made on 04/19/24 is very important. A break below that bottom will completely retrace the 04/19/24 to 07/16/24 extended Impulse wave. A break below 4,953.56 increases the probability of a larger developing down move
