In early 2018 the S&P 500 (SPX) had a blow off top. Mid-2024 could be a repeat of that spectacular peak.
The daily SPX chart courtesy of Trading View shows what happened from late 2017 to early 2018.

In the final 37 – trading days of the bull run – late 2017 to early 2018 the SPX gained 10.20%, followed by a 10 – trading day mini crash of 11.90%. The move up was so powerful that the RSI hit 86.69 – its highest daily reading in SPX history!
The daily NYSE – new highs chart ($NYHGH) courtesy of StockCharts.com illustrates the internal momentum of that era.

The final SPX move up late 2017 to 2018 saw a surge of new highs but diverged against the new highs made in late 2016.
The next daily SPX chart shows the action in 2024.
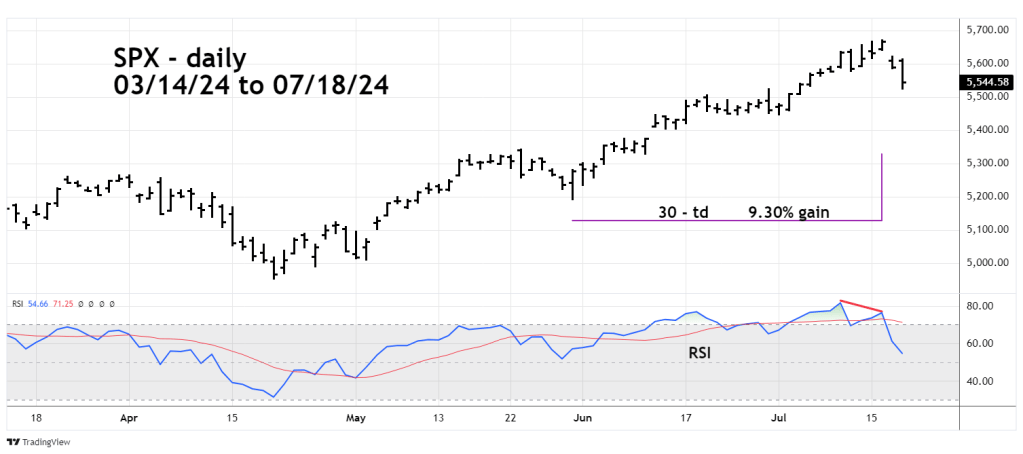
In 30 – trading days the SPX gained 9.30%. The daily RSI reached 81.67 and subsequently had a bearish divergence.
The daily NYSE – new highs chart show the internal momentum from 2021 to 2024.

Near – term there’s been a surge in new highs yet there’s still a long – term bearish divergence.
Its possible there could be a 10% mini crash within the next two – weeks.
The 07/14/24 blog “ Russell 2000 – Long -Term Elliott Wave Count – 07/12/24” noted the Russell 2000 (RUT) could have a post triangle trust up to 2,261.12. The high on 07/17/24 was 2,278.12.
Traders short 100% Russell 2000 non leveraged funds on the open of the RUT main session on 07/19/24. Use a move above the RUT – 07/18/24 high as a stop loss for half of the position. Use a move above the RUT high on 07/17/24 as a stop loss for the second half of the position.
