This is big! This websites prior post noted that the S&P 500 (SPX) was not near any long-term Fibonacci resistance. This analysis was based on the long -term SPX wave count from the March 2009 bottom. The SPX rally from March 2009 to April 2010 was presumed to be Primary wave [1] of a multi – year extended Impulse pattern.
The monthly SPX chart courtesy of Trading View illustrates a fascinating alternate Elliott wave count.
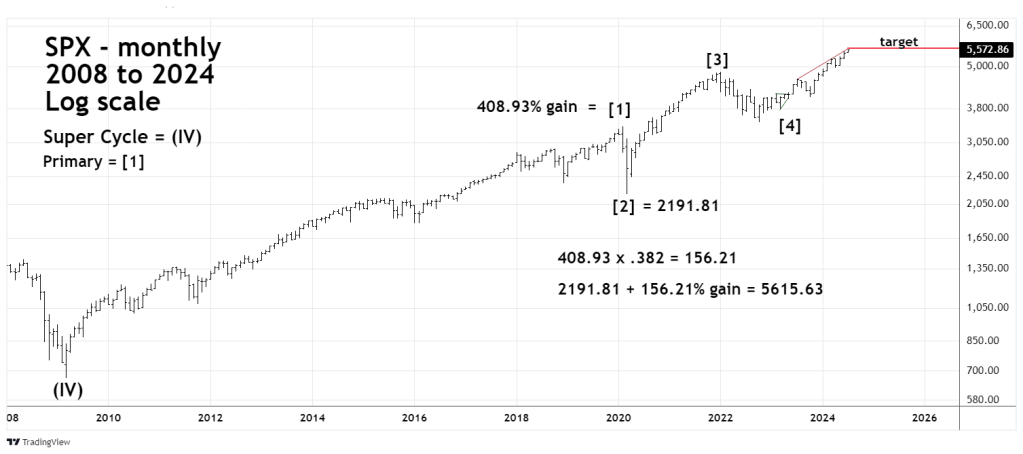
In this count Primary wave [1] terminates at the February 2020 peak. The rally from March 2009 to February 2020 gained 408.93 percent. Multiplied by the Fibonacci ratio of .382 equals 156.21 percent. Adding this gain to the March 2020 bottom of 2,191.81 targets SPX 5,615.63.
The SPX high on 07/08/24 was 5,583.11. The SPX is in the leeway zone of major Fibonacci resistance.
The SPX is still very close to the rising trendline from the July 2023 peak.
The SPX may have reached or could soon reach a historic top!
This is big!

bitcoin has a massive drop yesterday. On a Sunday after a holiday weekend I see this as significant
LikeLike
Yes it could be significant.
LikeLike