On the Summer Solstice 06/20/24 the Nasdaq Composite (IXIC) had a key reversal day as it made an all-time high. That top did not hold and on 06/28/24 the IXIC made another all-time high key reversal, this time accompanied by the S&P 500 (SPX).
The daily SPX chart courtesy of Trading View illustrates the action since June of 2023.

The SPX is still very close to the rising trendline connecting the peaks made in July 2023 and March 2024. Daily RSI now has a bearish divergence and has crossed its moving average line.
MACD – Histogram has a double bearish divergence, and the lines have a bearish cross.
The next daily chart courtesy of StockCharts.com shows the S&P 500 – Bullish Percent Index ($BPSPX)
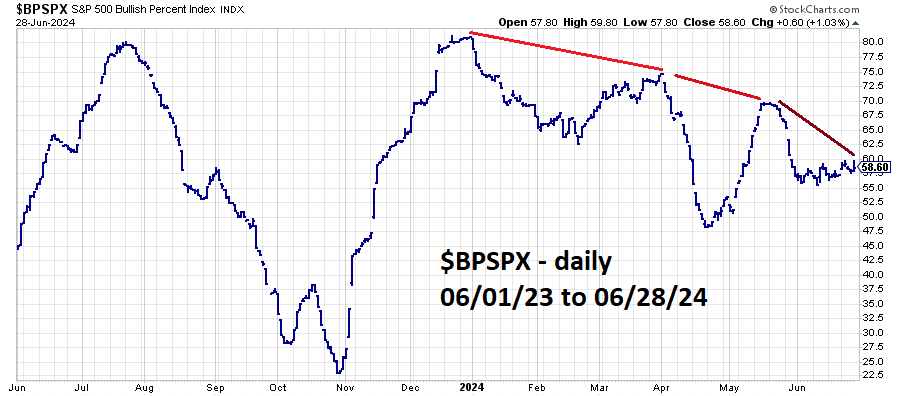
The Bullish Percent Index is simply the percentage of stocks that are on a point and figure buy signal and charted with a range of 0% to 100%.
Usually, stock index major tops are made after several months of Bullish Percent Index bearish divergences. In the current situation $BPSPX has a triple bearish divergence. Note the pathetic move up in June 2024 while SPX rallied 6%.
June 28, 2024 is the end of the second quarter, its possible fund managers could soon lock in profits from the recent rally.
