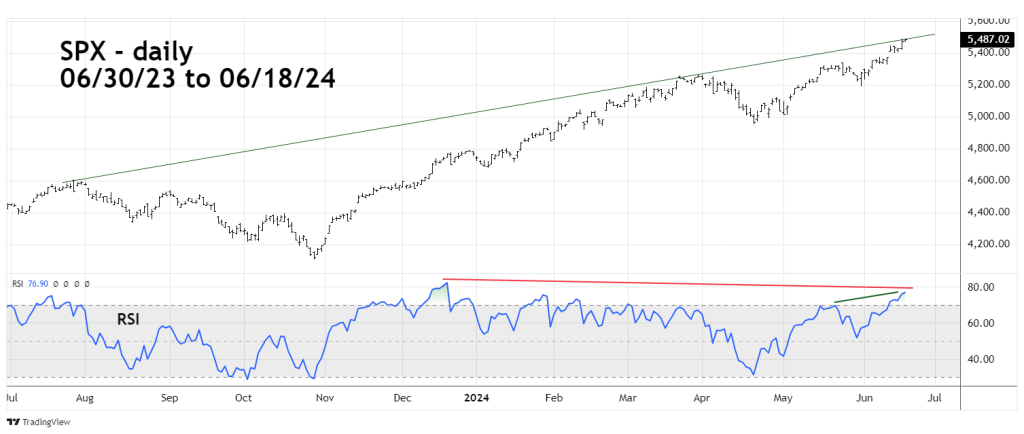
The 06/12/24 blog “The Incredible Shrinking U.S. Stock Market” illustrated that the S&P 500 (SPX) could find resistance at the rising trendline connecting the peaks made on 07/27/23 and 03/28/24. Also noted “In the next few trading days this line is in the area of SPX 5,470 to 5,480”. It took the SPX more than a few days to reach the trendline. The SPX high on 06/18/24 was 5,490.38.
The SPX chart courtesy of Trading View shows the action.
Also, on 06/18/24 the SPX reached a Fibonacci inverse ratio of the January 2022 to October 2022 bear phase.
The SPX January to October 2022 decline was 1,327.04 points.
The SPX October 2022 to June 2024 rally is so far 1,998.80 points.
1,998.80/1,327.04 = 1.508.
The SPX made a new all-time high on 06/18/24 unconfirmed by the Nasdaq Composite and the Dow Jones Industrial Average – a bearish “Rule of the Majority Signal”
The message from daily RSI is mixed. There’s a longer-term bearish divergence with the reading made on 12/19/23. Shorter – term RSI is at its maximum point since the 04/19/24 bottom. There’s usually at least one short-term RSI bearish divergence before a stock index price peak. Lack of a short-term RSI bearish divergence could mean the recent SPX rally is a blow off top.
A small number of stocks primarily in the Technology sector have greatly contributed to the recent SPX and Nasdaq Composite rallies. Termination of the Tech stock mania could trigger a broad-based decline for U.S. stocks.
Summer solstice is 06/20/24 – enjoy!
