The 06/13/24 blog “Quality Divergence” examined the short-term bearish divergence between the Dow Jones Industrial Average (DJI) and the Nasdaq Composite (IXIC).
The 06/12/24 blog “The Incredible Shrinking U.S. Stock Market” illustrated the intermediate degree bearish divergence between the IXIC and Nasdaq new highs.
Both of these important indicators are puny compared to the amazing colossal divergence between the Rusell 2000 (RUT) and the S&P 500 (SPX) .
The monthly RUT and SPX chart courtesy of Trading View shows their normal relationship.

Both the SPX – large cap stocks and RUT – small cap stocks usually trend together.
The next monthly RUT and SPX chart shows what’s happened since November 2021.

In late March 2024 while the SPX was making a new all-time high RUT had rallied to just below a Fibonacci .618 retracement of its 2021 to 2023 bear market. There’s a very good chance that the RUT rally after the October 2023 bottom is an intermediate degree bounce within a larger developing bear market. If so, in a few months RUT could break below its October 2023 bottom.
The daily RUT and SPX chart examines the action since February 2024.
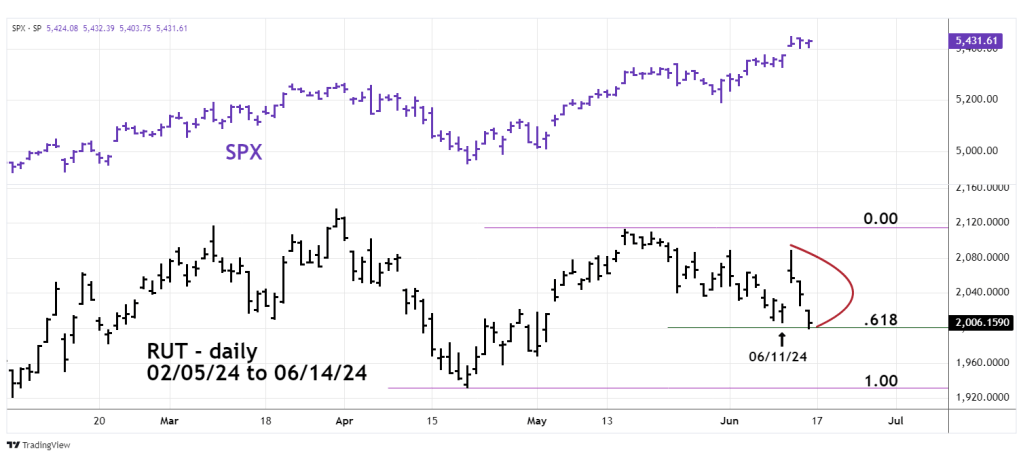
In mid – May the SPX exceeded its high made on 03/28/24. The RUT peaked below its 03/28/24 top. From then SPX continued to trend higher while RUT declined. Note the very sharp RUT drop in the prior three trading days. On 06/14/24 RUT broke below its 06/11/24 bottom.
The 15 – minute RUT and SPX chart zooms in on the intraday action.

The SPX made a bottom early in the 06/14/24 session and then trended up.
The RUT bottom was close to a .618 retracement of its 04/19/24 to 05/15/24 rally, it then traveled in a narrow bracket. This narrow bracket by itself is a bearish clue. RUT has broken below its 06/11/24 bottom, a decisive push below the Fibonacci .618 retracement level could trigger another sharp decline,
Its possible RUT’s recent three trading day drop could be just the beginning of a near vertical decline.
