The 05/16/24 blog “Updated S&P 500 – Elliott Wave Count – 05/16/24” illustrated that the S&P 500 (SPX) could be forming an Elliott wave – Expanding Flat correction from the January 2022 peak. This is still the most likely wave count; however, the peak of the presumed Primary wave [B] has exceeded its main target area.
The weekly SPX chart courtesy of Trading View shows what’s happened.
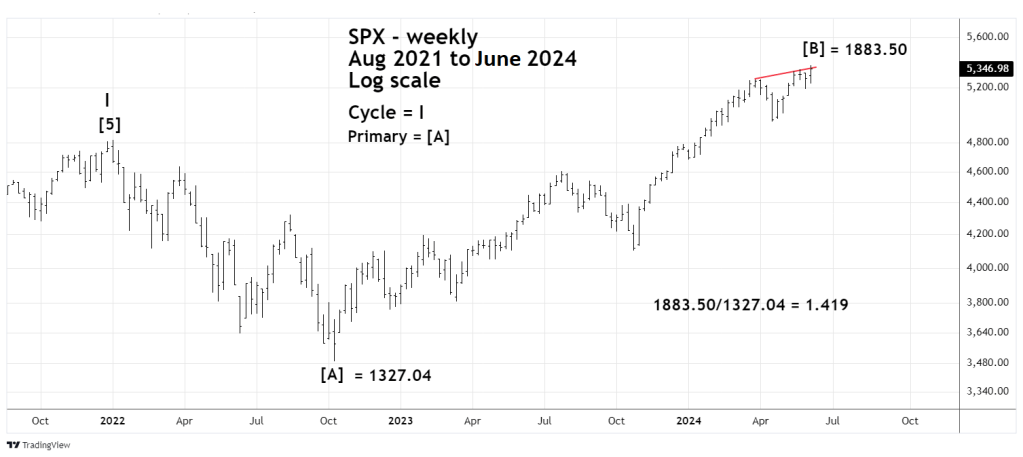
A common Fibonacci relationship between waves “B” and “A” is the Fibonacci inverse ratio of 1.382 of wave “B” to “A”.
The bullseye level for Primary wave [B] was 5,325.55 with leeway up to 5,350. The SPX high on 06/07/24 was 5,375.18 an Inverse Fibonacci relationship of 1.419 [B] to [A]. It’s additional evidence if a market turns within a Fibonacci leeway zone, but not necessary. Markets can turn at any level. There could also be other Fibonacci relationships in the play.
The next weekly SPX chart illustrates another Fibonacci price relationship that could be a factor in signaling a turn.

This relationship encompasses the entire bull move from the March 2020 bottom. The percentage gained from March 2020 to June 2024 is 145.23%. The bull phase from October 2022 to June 2024 has a gain of 53.49%. The ratio of these gains is .3714 within the leeway zone of the Fibonacci ratio of .382.
This relationship is between parts of two different Elliott wave structures. The presumed Primary wave [B] of an Expanding Flat and the presumed Primary wave [5] of Cycle wave “I”.
This opens the possibility that another Elliott wave structure has formed from March 2020 to June 2024. Even if this is the case, the Fibonacci relationship implies a decline in proportion to the progress made since the 2020 bottom.
For the prime wave count – an Expanding Flat starting in January 2022, the subsequent decline could retrace all the way back to at least the October 2022 bottom.
If an alternate wave count from October 2020 to June 2024 has formed, the subsequent decline could be in the range of 20 to 25% from current levels.
The next weekly SPX chart shows a potential Fibonacci time relationship.

The bull market from 03/23/20 to 06/07/24 was 1,060 trading days (td). The bull phase from 10/13/22 to 06/07/24 was 414 td. A ratio of 414/1060 is .3905 within the leeway of the Fibonacci ratio of .382.
These Fibonacci price/time relationships are just the tip of a bearish iceberg . If a significant top was made on 06/07/24, U.S. stocks could be entering a multi- month bear market.
