Sometimes markets makes turns on Full/New Moons plus or minus two – trading days. These turns are more likely to occur after prolonged moves up or down when mass emotions peak. On 06/05/24 the S&P 500 (SPX) and Nasdaq Composite (IXIC) made new all-time highs. On 06/06/24 there’s a New Moon.
The daily SPX chart courtesy of Trading View compares its performance to the Dow Jone Industrial Average (DJI) and the Russell 2000 (RUT).
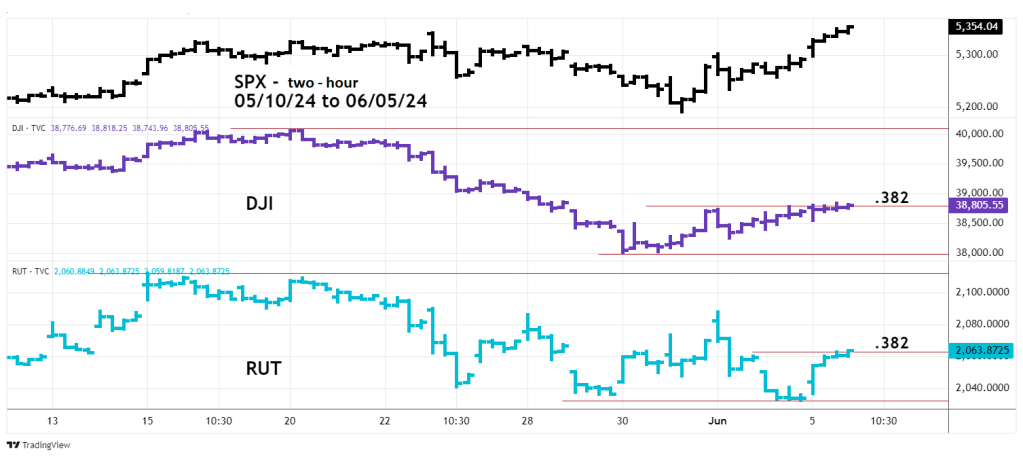
On 05/28/24 the IXIC made a new all-time high unaccompanied by the other two main U.S. stock indices, SPX and DJI. This is what I call a bearish “Rule of the Majority” signal. The SPX and IXIC moves to new all-time highs on 06/05/24 invalidated that bearish signal and is a short-term bullish signal. The DJI could have a hard time making a new high because it has only retraced 38% of its most recent decline.
The RUT, which is composed of small cap stocks, has also only retraced 38% of its prior drop.
The size of these bearish divergences is shocking! But wait, there’s more. The daily NYSE new highs ($MAHN) chart courtesy of Barchart.com illustrates internal momentum.
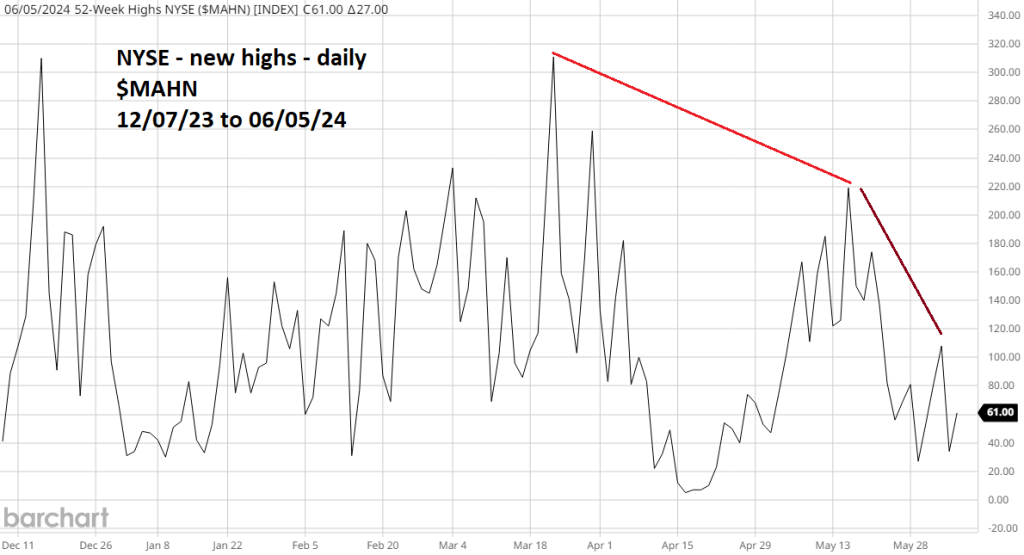
The message from this chart is even more bearish!
With the exception of a brief surge up in mid – March most stocks in the NYSE struggle to make new highs.
There’s a high probability that these bearish divergences are the prelude to a broad-based drop.
A solo new high of a main U.S stock index 06/06/24 to 06/10/24 could signal an important top.
