A break below Golds closest support could trigger a 10% decline.
Point & Figure (PF) charts are very good at discovering potential support and resistance areas. The daily PF- Gold Continuous Contract ($GOLD) chart courtesy of StockCharts.com illustrates its action.

Point & Figure charts consist of columns of X’s and O’s that represent filtered price movements. X-Columns represent rising prices and O-Columns represent falling prices. Each price box represents a specific value that price must reach to warrant an” X” or an “O”. Time is not a factor in P&F charting; these charts evolve as prices move.
Support/resistance areas are rows of “X’s” and “O’s”. The length of the row indicates potential strength or weakness. A continuous row of nine is stronger than a row of three.
$GOLD has recently gone below a row of six to a row of two. Just below is a single “O”. The important area is the next instance of a single “O” which is at 2,280 to 2,290.
Below 2,280 there’s “air”, no continuous rows until the row of three in the 2,200 to 2,210 block. Below this level is more significant support – a row of five in the 2,170 to 2,200 area. If $GOLD breaks below 2,280 it could quickly decline to 2,170 to 2,200.
If $GOLD can reach this level a bottom may not last very long. The daily Gold in U.S. Dollars (XAUUSD) courtesy of Trading View examines momentum.
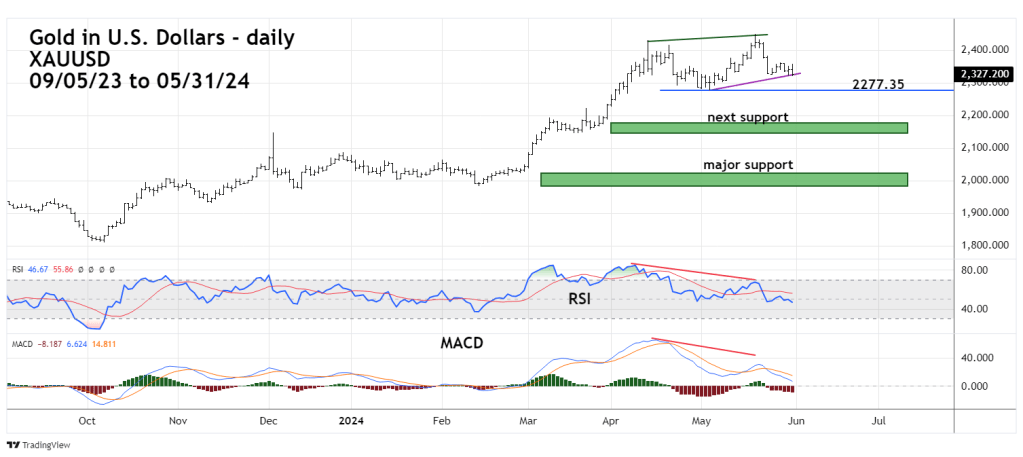
Golds recent all-time high had significant bearish divergence on both the RSI and MACD.
The 05/31/24 daily RSI reading was 46.70 the oversold zone begins at 30.00. MACD lines are above the zero – level. Based on current momentum Gold could have a large move down before making a significant bottom.
On the XAUUSD chart if Gold breaks below 2,277 it could fall to the 2,170 to 2,200 zone.
A break below XAUUSD 2,146 could open the door for a drop to the 2,020 to 2,030 area.
