Most U.S. stock indices appears to have made significant peaks. However, one main stock index could still make a new all-time high.
The 30 – minute Nasdaq Composite (IXIC) chart courtesy of Trading View illustrates its short-term action.
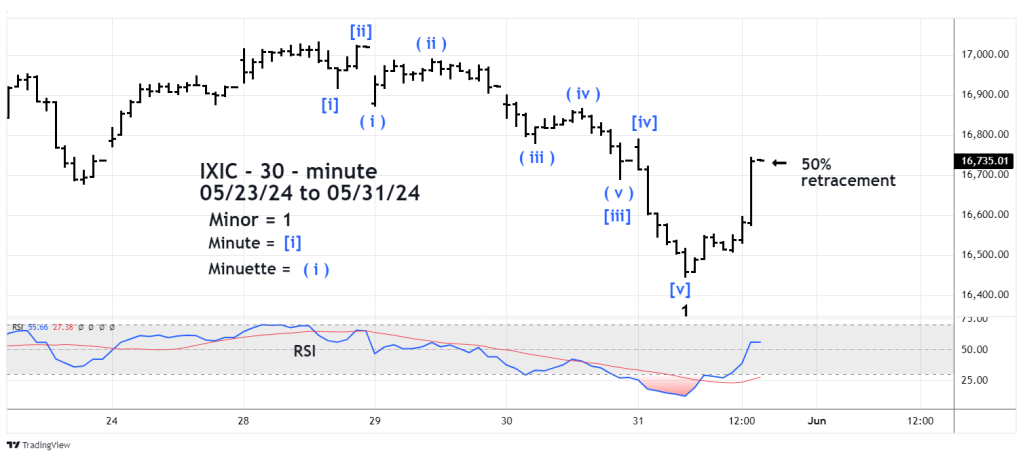
On 05/28/24 the IXIC made an all-time high unconfirmed by the Dow Jones Industrial Average (DJI) and the S&P 500 (SPX). This was a bearish “Rule of the Majority” signal implying an important top.
The subsequent decline formed an extended Elliott Impulse wave. In stocks third waves typically extend. Note that Minute wave [iii] clearly sub divides into five waves. The entire move down is most likely the first wave of a larger developing bear pattern.
Note the rally on 05/31/24 is larger than any of the prior moves up during the 05/28/24 to 05/31/24 decline. The size of the movement implies it’s a correcting the progress of the 05/28/24 to 05/31/24 decline and probably Minor wave “2”.
At the end of the 05/31/24 trading session IXIC had retraced 50% of the prior decline. Late in the 05/31/24 session the momentum was strong. Its possible IXIC could continue to rally, perhaps to a Fibonacci .618 retracement of the prior decline. A move above the 05/28/24 peak would invalidate the presumed Minor wave “1” count.
The next 30 – minute chart examines the DJI.
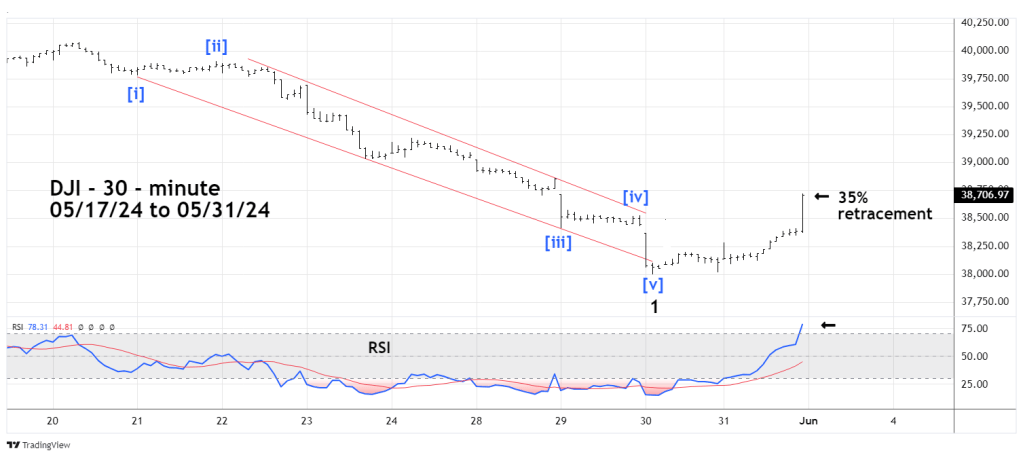
DJI made its all-time high on 05/20/24 and has been downside leader. By 05/31/24 DJI had retraced most of its 04/17/24 to 05/20/24 rally. The DJI decline from 05/20/24 has also been an extended Impulse wave. Most of the movement stayed within the boundaries of the trend channel.
The subsequent rally on 05/31/24 was the weakest of the three main U.S. stock indices – only a 35% retracement. The 30 – minute RSI ended the session in the overbought zone. Stock index peaks usually occur with at least one RSI bearish divergence. The 30 – minute RSI reading implies additional short-term upside action.
The next 30-minute chart shows the SPX short-term action.

The SPX made its all-time high on 05/23/24 and its subsequent drop was not as smooth as the IXIC or DJI.
The 05/23/24 to 05/31/24 decline counts best as an Elliott wave – Double Zigzag correction. This pattern implies the SPX could soon exceed its 05/23/24 peak. The SPX late day action on 05/31/24 supports this theory. The SPX move up in the final 30 – minutes of the 05/31/24 session was exceptionally strong. SPX has retraced 59% of its prior decline and 30 – minute RSI has not reached the overbought zone.
If the SPX exceeds the 05/23/24 peak, it’s most likely to happen during the first half of the 06/03/24 trading session.
A new SPX high unconfirmed by DJI and IXIC could set the stage for the next decline.
