On 05/30/24 Nvidia Corporation (NVDA) high was 1,158.19. Major Fibonacci resistance illustrated in the 05/25/24 blog “Nvidia Nears Major Fibonacci Resistance at 1,157.00” was 1157.70. Today’s high was almost a bullseye hit.
The daily NVDA chart courtesy of Trading View updates its action.
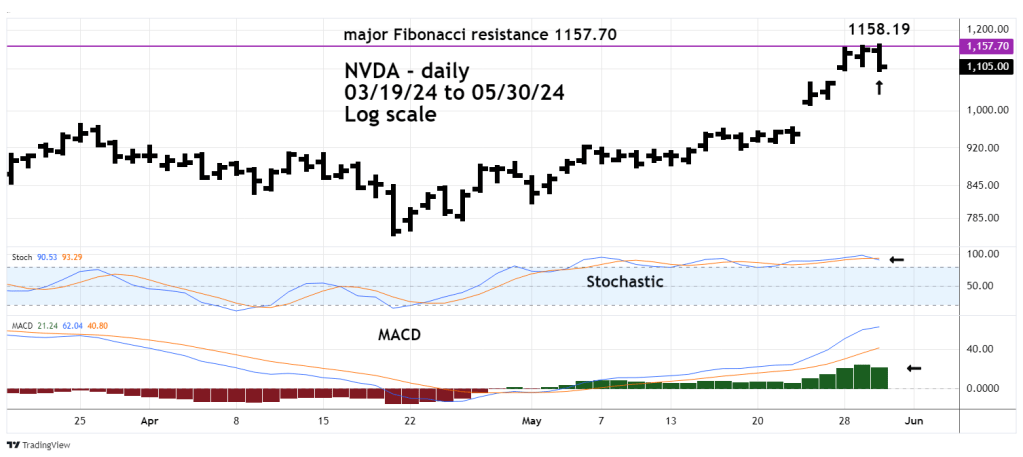
NVDA then declined from 1,158.19 and closed below its 05/29/24 session low.
Daily NVDA – MACD – Histogram flattened out.
Daily Stochastic has a bearish lines cross.
The daily Dow Jones Industrial Average (DJI) chart illustrates its drop since 05/20/24.

The DJI as of 05/30/24 has retraced 84% of its 04/17/24 to 05/20/24 rally.
Daily RSI is at 34.81 and still above the oversold boundary at 30.00. There’s a good chance DJI could soon be at or below its 04/17/24 bottom.
The DJI decline from 05/20/24 appears to be an Elliott Impulse wave. If so this could be just the first wave down of a larger developing bear trend.
The NVDA new high on 05/30/24 was unconfirmed by all of the other “Magnificent Seven” stock. None of the three main U.S. stock indices made new all-time highs.
If NVDA has made a major top it implies the speculative mania driving U.S. stocks since October 2023 has been exhausted.
The main U.S stock indices could be in the early part of a sharp multi – week decline.
