The 03/16/24 blog “Nvidia – Long – Term Elliott Wave Count” illustrated that Nvidia Corporation (NVDA) was in a developing extended Elliott Impulse wave from its November 2008 bottom. Additionally, NVDA had major Fibonacci resistance at 1,157.70. On 05/24/24 NVDA ended the main trading session at 1,064.69.
The monthly NVDA chart courtesy of Trading View updates the action.
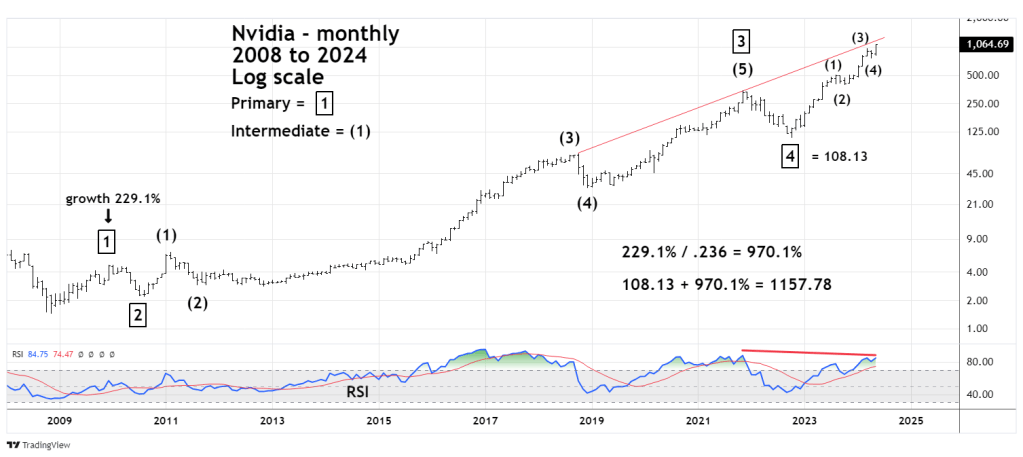
The NVDA chart in the 03/16/24 blog illustrated that the presumed Primary wave “5” only had a three-wave subdivision. Please note that the move up from the October 2022 bottom now has a five-wave subdivision, and that NVDA is now in a presumed Intermediate wave (5) of Primary wave “5”.
In November 2021 monthly RSI was 87.81.
In March 2024 monthly RSI was 84.83.
In May 2024 monthly RSI is 84.75. A double bearish divergence.
In regard to the long – term Fibonacci calculation the 03/16/24 blog noted.
“Usually there’s a Fibonacci relationship between the first and fifth waves of an Impulse pattern. Because NVDA has such a large percentage move from the November 2008 bottom, its more appropriate to measure growth rates.
Primary wave “1” which peaked in December 2009 had a growth rate of 229.1% divided by the Fibonacci ratio of .236 equals a growth rate of 970.1%. The bottom of Primary wave “4” was 108.13, adding a growth rate of 970.1% to this bottom targets a Primary wave “5” peak at 1,157.70.”
Also note NVDA is nearing the rising trendline connecting the peaks made in October 2018 and November 2021.
The weekly NVDA illustrates an alternate long – term Fibonacci calculation.
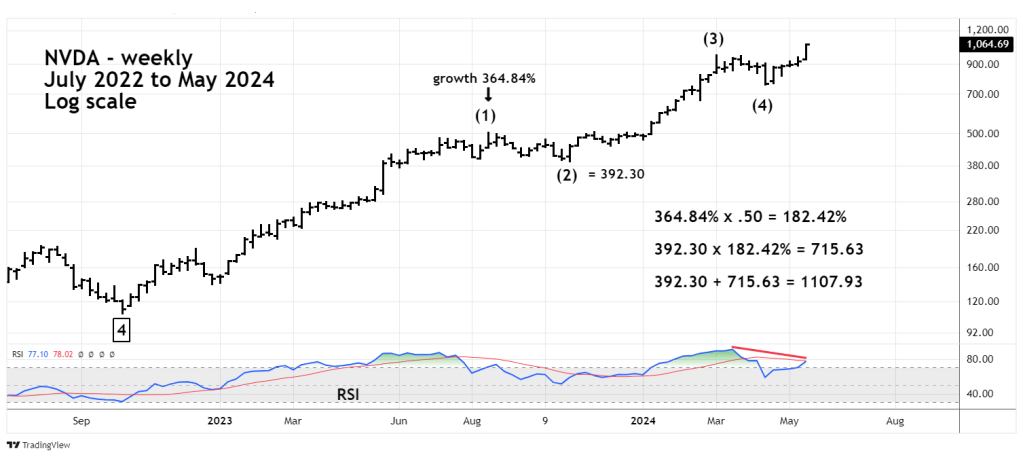
Sometimes there’s a Fibonacci relationship between the first wave of a motive pattern and the distance from the second wave to the fifth wave termination.
In this instance Intermediate wave (1) had a growth rate of 364.84% multiplied by the Fibonacci ratio of .50 yields a growth rate of 182.42%. The bottom of Intermediate wave (2) is 392.30 adding the growth rate of 182.42% targets a NVDA top at 1,107.93.
Perhaps NVDA could split the difference between the two Fibonacci coordinates of 1,157.70 and 1,107.93 and peak near 1,132.
The daily NVDA chart updates its short-term progress.
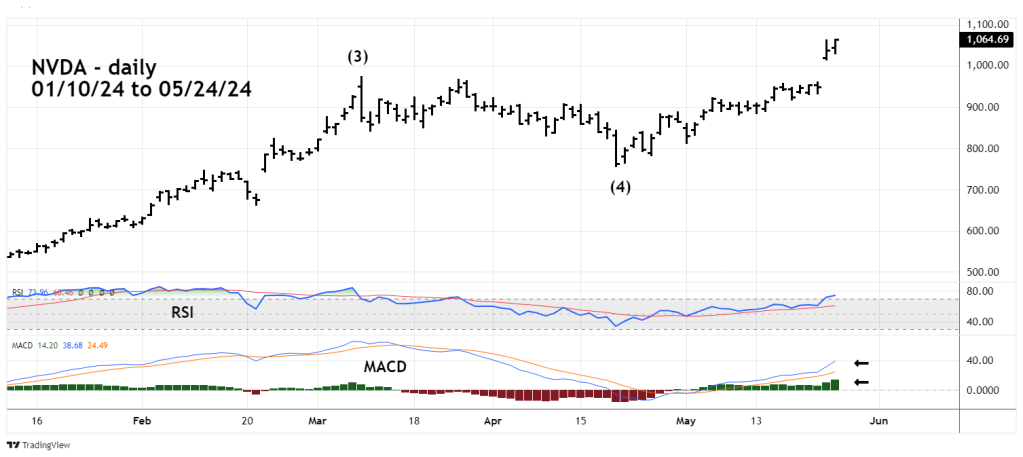
On 05/24/24 NVDA made a new all-time high with daily MACD – Histogram and lines still rising. These two components will need to at least flatten out before a price peak can be made. The current MACD reading implies at least a rally for a few days.
NVDA is the king of all U.S. stocks. NVDA making new highs is one reason the main U.S. stock indices – particularly Nasdaq continue to rally.
If the long-term Elliott wave count is correct, NVDA could soon enter a multi-month bear market.
NVDA could be just a few trading days from making a significant peak. The broad zone for a possible top is NVDA 1,100 to 1,170.
