External momentum indicators are derived from price action, they measure the speed of a market and aid in determining overbought/oversold conditions.
The daily S&P 500 (SPX) chart courtesy of Trading View shows what’s been happening in 2024.

Daily Stochastic has reached the overbought zone and has flat lined. On a daily scale Stochastic could continue sideways in the overbought zone for days or even weeks.
For stock indices most of the time price will make a significant peak with at least one bearish RSI divergence. So far in the move up from the 04/19/24 bottom daily RSI does not have a bearish divergence. The recent high reading on 05/15/24 – RSI reached 69.31 just below the overbought boundary of 70.00.
The weekly SPX chart shows what’s happened since late 2020.
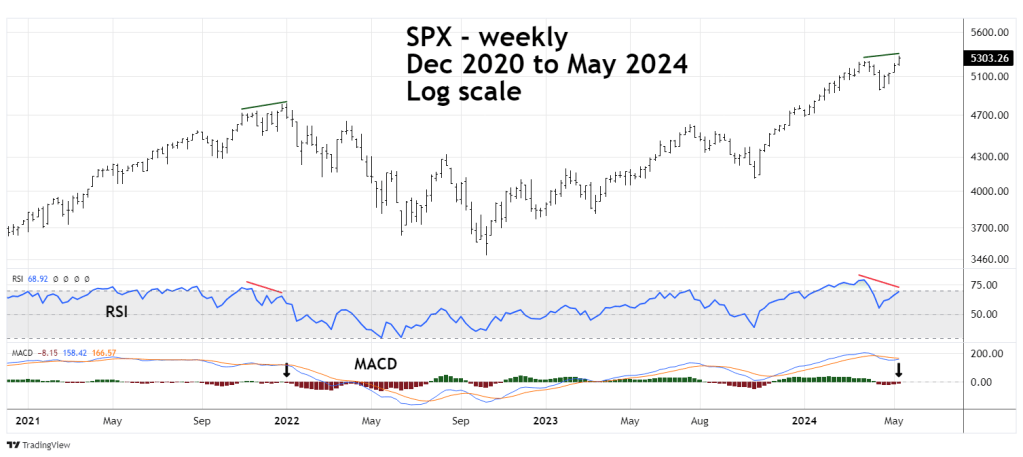
Currently weekly RSI has a significant bearish divergence vs. its reading in late March 2024. Also, MACD histogram has gone negative.
These recent readings are very similar to what was recorded at the prior significant SPX peak made in early 2022.
The monthly SPX chart illustrates the action since 2017.

Monthly RSI has a bearish divergence vs. the late March 2024 level and a divergence with the January 2022 top.
Stochastic after going sideways for several months now has a bearish line cross.
Current external momentum indicates the SPX could be forming a peak of the same degree as it made in January 2022.
These reading come when the SPX has recently hit significant Fibonacci resistance at 5,325. Please see the 05/16/24 blog “Updated Long-Term S&P 500 – Elliott Wave Count – 05/16/24”.
It’s possible the SPX has already made a significant peak. If not, an important top could be made in the next few trading days.
