The S&P 500 (SPX) has entered the territory of potential major Fibonacci resistance.
For several months this website has speculated that the SPX from its January 2022 peak could be forming an Elliott wave Expanding Flat corrective pattern.
The following illustration is an Expanding Flat in a bull market.

Expanding Flats are composed of three sub waves. The first wave “A” sub divides into a three-wave pattern or a combination of three waves patterns. The second wave “B” is also composed of three waves or a combination of three waves. The second wave terminates beyond the point of origin of the first wave. The final wave is composed of five – waves and ends below the termination point of the first wave.
The SPX monthly chart courtesy of Trading View shows an actual Expanding Flat that occurred from 2000 to 2009.

In October 2007 the SPX marginally exceeded the Expanding Flat point of origin that began in March 2000.
The most common Fibonacci relationship between wave “B” and wave “A” is the inverse Fibonacci ratio of 1.236. The next most common Fibonacci relationship is 1.382.
The weekly SPX chart shows the presumed developing Expanding Flat since the January 2022 peak.

The January to October 2022 decline is the presumed Primary wave “A”. It’s length was 1,327.04 points. Multiplied by the Fibonacci inverse ratio of 1.382 equals 1,833.97 points, added to the Primary wave “A” bottom of 3,491.58 targets SPX 5,325.55 as the end of Primary wave “B”.
The SPX peak on 05/16/24 was 5,325.49. There’s always leeway around Fibonacci support/resistance levels. In this case leeway could extend to SPX 5,350.
The 30-minute SPX chart updates the short-term Elliott wave count illustrated in the 05/15/24 blog.
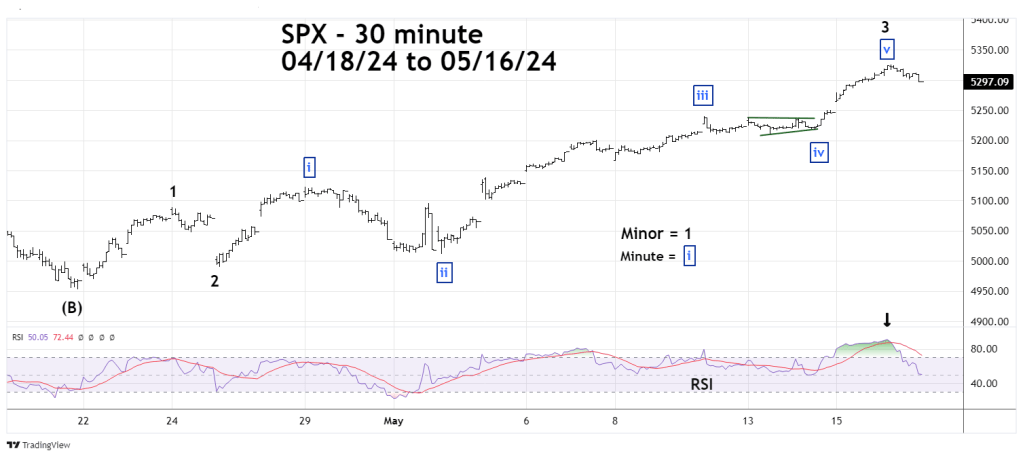
It appears the SPX at the 05/16/24 peak may have completed Minor wave “3.” The presumed Minor wave “4” could be complete at the 05/16/24 bottom or could complete early in the 05/17/24 session.
Note that at the 05/16/24 top the 30 – minute RSI reached 90.91 this is incredibly deep in the overbought zone and implies the recent rally was a miniature mania.
Most of the time stock indices make significant tops with at least one RSI bearish divergence. An SPX move above its 05/16/24 peak with a bearish divergence on the 30 – minute RSI, could signal an important top.
