On 05/09/24 the S&P 500 (SPX) marginally broke through “Volume Profile” resistance in the low 5,200 area. On 05/10/24 there was a decisive move above resistance. Unless the SPX can break below 5,200 it could soon at least return to the 03/28/24 all-time high.
The daily SPX chart courtesy of BigCharts.com updates the external momentum.

At the SPX high on 05/10/24 it had retraced 92% of the March to April decline. In one or two trading days it could reach the next potential resistance level – a 100% retracement.
Daily RSI favors this scenario as it has so far reached 62%. The overbought zone begins at 70%. Slow Stochastic has reached its overbought zone above 80% with a bearish line cross. Daily Slow Stochastic can remain in the overbought zone for several days, even weeks.
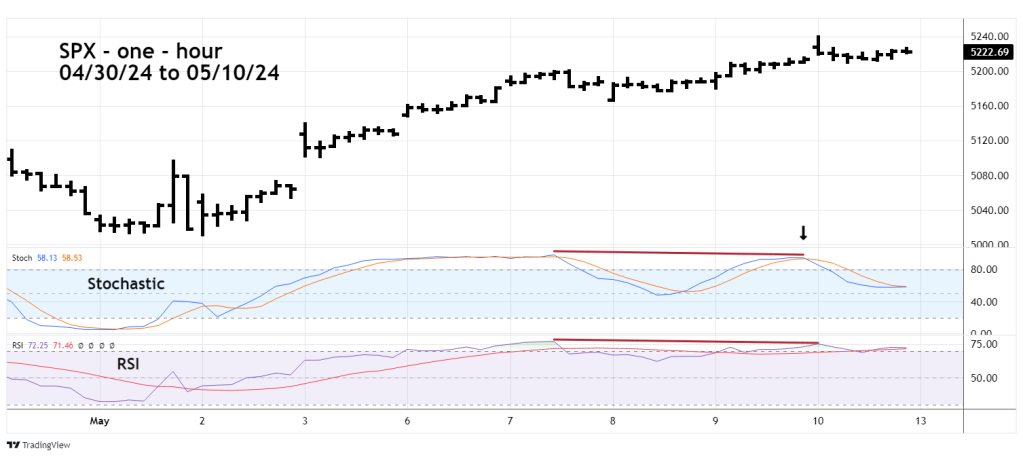
The one – hour SPX chart courtesy of Trading View zooms in on the intraday action.
The main factor favoring the bears is the sharp decline just after economic reports released at 10:00 AM – EDT. However, the day’s low was 5,209.68, just above the prior resistance at 5,208. This is a classic example of prior resistance becoming support.
At the 05/10/24 high hourly Stochastic had a bearish divergence and a bearish line cross. Hourly RSI also had a bearish divergence.
These intraday indicators hint there could be short-term downside action.
SPX 5,200 is the important level to watch. A decisive break below 5,200 could mean that the SPX high on 05/10/24 was a secondary peak in a still developing bear trend.
