The prior two blogs noted both the S&P 500 (SPX) and Russell 2000 (RUT) may have found resistance just below a Fibonacci .618 retrace of their respective April declines. Subsequently both indices have moved above the resistance zones. The door is open for both indices to make new 2024 highs.
The daily RUT chart courtesy of Trading View updates the action.
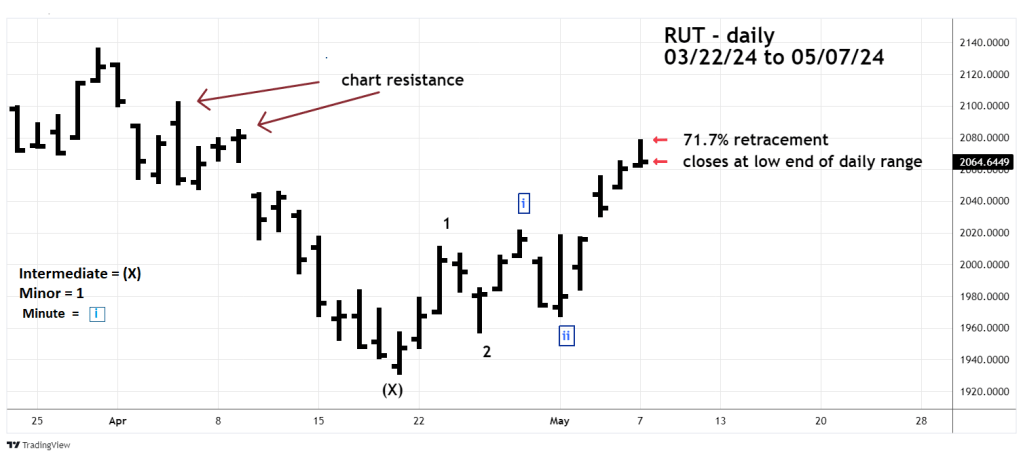
RUT has so far retraced 71.7% of its March to April drop. It appears that RUT could be in an Elliott third of a third wave up from its 04/19/24 bottom. This type of action in an uptrend is very bullish. However, after the midday high the subsequent drop almost wiped out all of the days upside progress. This is not what would be expected in a powerful uptrend.
If the rally continues RUT needs to overcome chart resistance at the 04/09/24 and 04/04/24 highs.
On 05/07/24 RUT moved above 1270.00 which was the stop loss level for a 100% short of non-leverage RUT funds initiated at the open on 04/01/24. The gain on 50% of the position is 1.3%. Continue holding the remaining half position with a stop just above the RUT 04/04/24 top.
