U.S. stocks had a wild ride on 05/01/24 – U.S. FOMC interest rate announcement. By the end of the 05/01/24 session the huge rally after the FOMC press conference had been completely retraced. Daily and hourly momentum remains bearish, implying the next wave of post March 2024 bear move may have begun.
The daily S&P 500 (SPX) chart courtesy of BigCharts.com illustrates three momentum indicators.
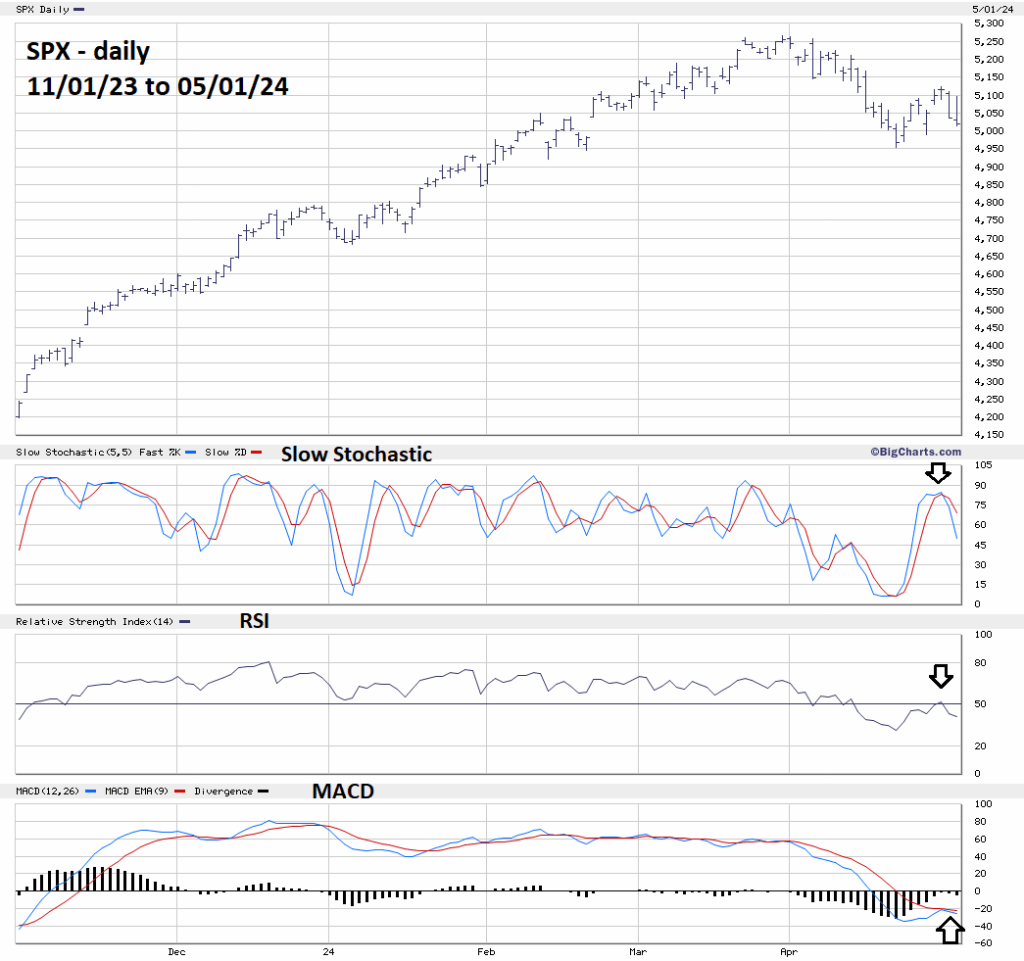
Slow Stochastic has bearish lines cross in the overbought zone.
DAILY RSI has hit the 50% line and turned down. This usually happens after a pause in a daily bear trend.
MACD lines failed to have a bull cross and are still below the zero line.
The one – hour Russell 2000 (RUT) chart courtesy of Trading View illustrates its intraday momentum.
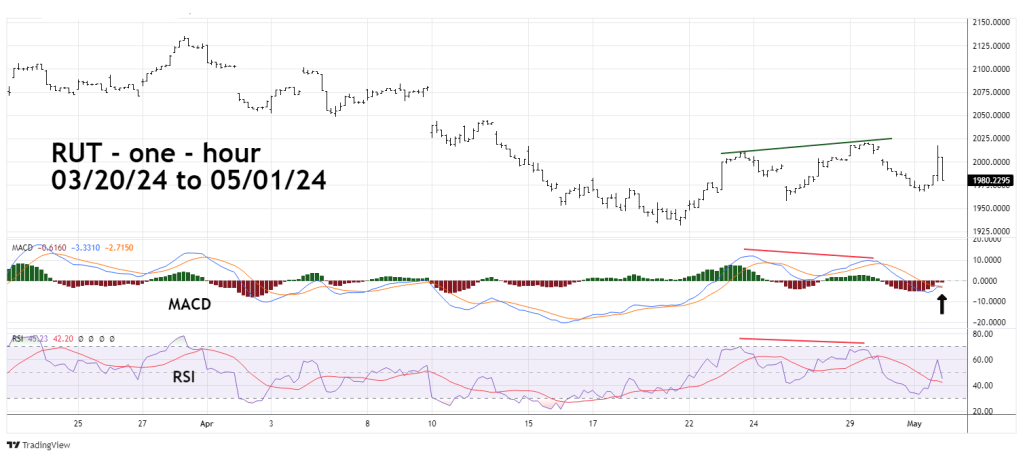
The 04/28/24 blog “Russell 2000 Relative Weakness to the S&P 500” illustrated that RUT had failed to exceed it 04/23/24 peak. On 04/30/24 RUT went above the 04/23/24 top with bearish momentum divergences.
On 04/30/24 MACD lines and Histogram had bearish divergences.
Hourly RSI also had a bearish divergence.
If both the SPX and RUT break below their 04/19/24 bottoms it could open the door for at least a two-week decline.
The 04/07/24 blog “Seasonal Patterns of the S&P 500” noted that April is a seasonally bullish month. The SPX, RUT, Dow Jones Industrial Average, and Nasdaq Composite ended April 2024 down from March 2024. This counter seasonal move could be a bearish signal for the remainder of 2024. A bear market for U.S stocks could continue into late 2024 or early 2025.
