The 04/21/24 blog “Potential S&P 500 Bottom – Early May 2024” illustrated the S&P 500 could make an important bottom on 05/03/24. The size of the S&P 500 (SPX) rally since 04/19/24 makes that forecasted bottom date a low probability. If the SPX resumes its decline 05/17/24 could mark a significant bottom.
The daily SPX chart courtesy of BigCharts.com illustrates its momentum.

The very effective BigCharts.com Slow Stochastic indicator shows that both lines have reached the overbought zone above 80.00. Also note that the prior instance of Slow Stochastic in the overbought zone was at the SPX penultimate peak made on 03/21/24.
The current Slow Stochastic reading implies the SPX could resume a downtrend on 04/29/24.
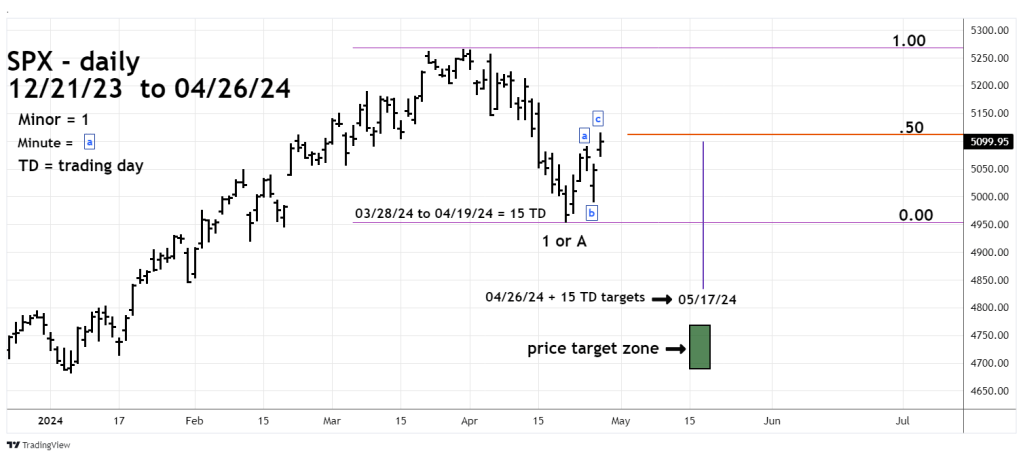
The daily SPX chart courtesy of Trading View shows the first Fibonacci time cycle.
The 04/24/24 blog “Russell 2000 – Clear Elliott Wave Pattern” illustrated the Russell 2000 March to April decline as an Elliott Impulse pattern. The Elliott pattern for the SPX decline is not as clear, the 03/28/24 to 04/19/24 movement could be a complex corrective pattern. If necessary this alternate wave count labeled as Minor wave “A” will be examined in a future blog.
The rally since 04/19/24 is an Elliott wave Single Zigzag. If complete it marks the separation point for two phases of a still developing drop. Note that the SPX high on 04/26/24 was just beyond a Fibonacci .50 retracement of the 03/28/24 to 04/19/24 movement.
The 03/28/24 to 04/19/24 decline phase lasted 15 – trading days (TD). Sometimes two phases of a larger movement can be equal in time. Adding 15 TD to the 04/26/24 peak targets a potential market turn on 05/17/24.
The broad target zone for a potential SPX bottom is in the area of the December to January 2024 correction.
The next daily SPX chart shows the second Fibonacci time cycle.
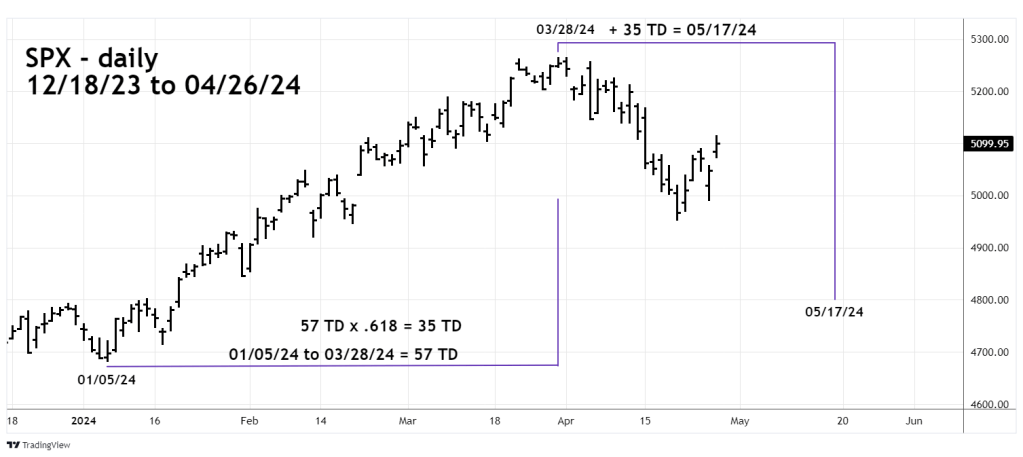
The SPX 01/05/24 to 03/28/24 rally lasted 57 TD multiplied by the Fibonacci ratio of .618 equals 35 TD. Adding 35 TD to the 03/28/24 peak targets 05/17/24.
Having two Fibonacci time cycles targeting the same day is rare. If the SPX breaks below its 04/19/24 bottom and is declining into 05/17/24 – an important bottom could be forming.
