For several months the focus has been on when the U.S – FOMC will cut short -term interest rates. In the meantime, rates/yields have been rising on long term – 5-to-30-year U.S. Treasury securities.
The monthly 5 – year Treasury yield (FVX) chart courtesy of Trading View shows what’s been happening.
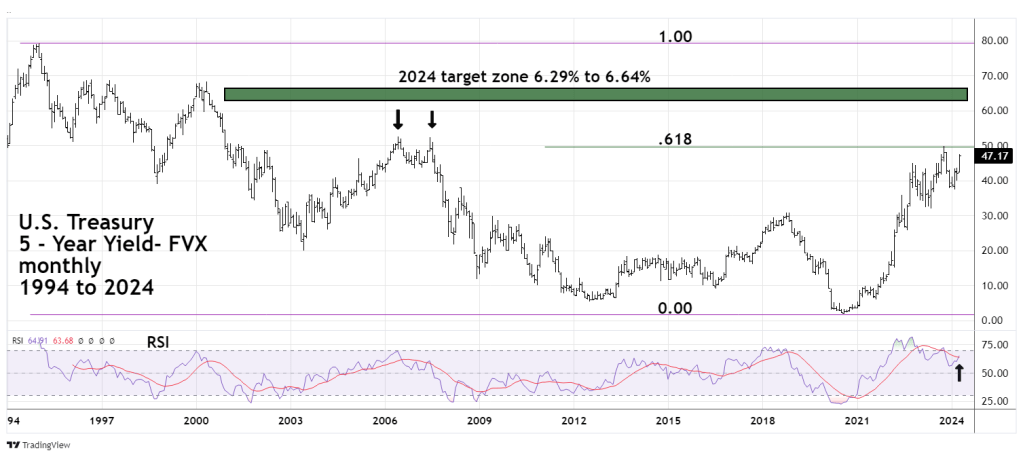
After rising for more than three years FVX peaked in October 2023 at 4.98%. This top is almost an exact Fibonacci .618 retracement of the 1994 to 2020 decline. The .618 retrace level is strong resistance, a significant move above that level could open the door to at least a multi-month rally.
The next potential resistance area is the double top at 5.24% and 5.26% made in 2006.
If that level is broken there’s no chart or Fibonacci resistance until the 1999 to 2000 highs. The broad resistance zone is 6.29% to 6.64%. Its possible this zone could be reached in late 2024.
The monthly RSI has recently had a bullish cross of its moving average line and is below the overbought zone. Note that the last time monthly RSI reached the overbought zone it stayed overbought for several months.
If longer term U.S. Treasury yields continue to rise it could adversely affect the U.S. economy and stock market.
