From October 2022 to March 2024 the Nasdaq Composite (IXIC) lead the way, gaining 31% vs S&P 500 (SPX) up 28% and Dow Jones Industrial Average (DJI) up 22%. On 04/19/24 IXIC declined 2.05% vs. SPX down .88%. The DJI was up .56. The IXIC dramatic drop on 04/19/24 implies more downside action for U.S. stocks.
The daily IXIC chart courtesy of Trading View illustrates what’s happened since December 2023.
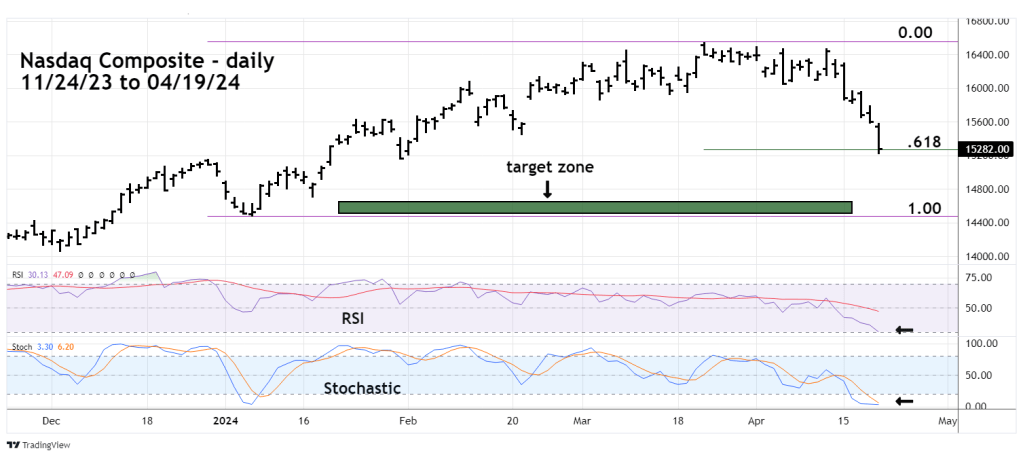
Just one week ago it appeared the IXIC could make a new all-time high. Then on 04/15/24 IXIC broke below two important support levels – noted in the 04/15/24 blog “Nasdaq Composite Bearish Breakthrough”. For the remainder of the week IXIC closed each daily session with a loss.
Daily RSI has reached the boundary of the oversold zone. Daily Stochastic is in the oversold zone. Sometimes daily Stochastic can remain in the overbought/oversold zone for several weeks. Note that in late December 2023 Stochastic was in the overbought zone for two weeks.
On 04/15/24 IXIC reached potential support at the Fibonacci .618 retracement of the January to March rally. If IXIC significantly moves below the .618 retrace level it opens the door for a drop to the next Fibonacci ratio 1/1 – a 100% retracement of the January to March rally.
The next daily chart is the Invesco QQQ trust (QQQ) which is an ETF of the Nasdaq 100.

Illustrated is the QQQ Volume Profile which places volume on a vertical axis. This method matches volume with price levels and is useful in identifying potential support/resistance. The wider the volume cluster the greater the potential support/resistance. The widest part is called Point of Control (POC).
QQQ has broken below the main and secondary POC levels. These are significant breakthroughs. There’s a high probability QQQ could reach its January 2024 bottom.
The daily Nvidia Corporation (NVDA) chart shows its recent action.
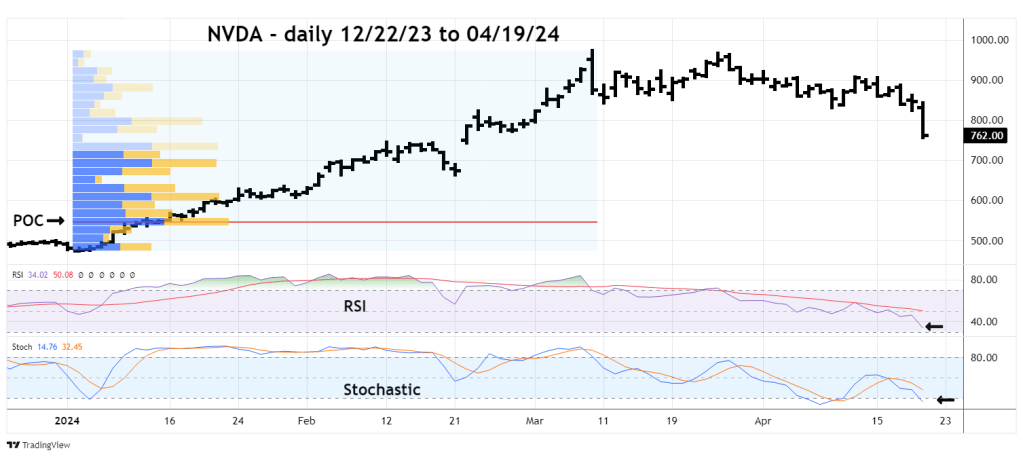
One week ago, the NVDA appeared ready to make a move up to 1,000. On 04/18/24 NVDA broke below support of what looked like a shallow correction. On 04/19/24 it dropped 10%!
Daily RSI is still above the oversold zone and only the lower Stochastic line has reached the oversold level.
Price tends to be drawn to POC. NVDA on 04/19/24 has reached a secondary POC level, the current RSI and Stochastic implies this support could be broken. However, note there are two other secondary POC levels, one from about 680 to 700. The other from 600 to 620. Its possible NVDA could make a significant bottom at either of those levels. Most bearish scenario is a drop down to the main POC near 550.
The very bearish action of Nasdaq stocks on 04/19/24 suggests more downside action for the U.S. stock market. Price target for a significant bottom is the area of the January 2024 decline. Time target is late April -early May 2024.
Traders are 100% short non-leveraged Russell 2000 funds from the open on 04/01/24. Continue holding short.
