The Volume Profile method identifies potential support for the S&P 500 and the Russell 2000.
Volume profile places volume on a vertical axis and identifies support/resistances areas. The wideset volume cluster is called Point of Control (POC) which represents the strongest potential support/resistance. Price is drawn to or is repelled by POC.
The first daily chart courtesy of Trading View shows the Volume Profile for the S&P 500 continuous futures contract.
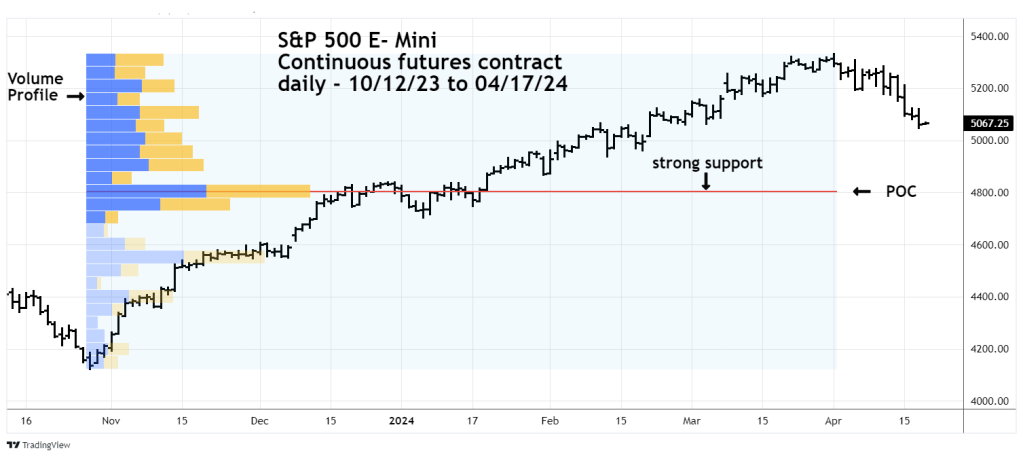
The time frame for this profile is from October 2023 bottom to March 2024 top. The strongest potential support level is in the middle of the late December 2023 to early January decline. This is also near a Fibonacci .50 retracement of the October to March rally.
The next daily chart shows the Rusell 2000 continuous futures contract.

The Russell 2000 Volume Profile has a different shape than the S&P 500 and the price has already broken below POC.
The 04/12/24 blog “Russell 2000 – Short – Term Elliott Wave Pattern – 04/12/24 noted that Minor wave “3” could still be extending. It would take a powerful movement to break below POC. The recent POC breakthrough supports the theory that an Elliott third of a third wave down is developing. This is usually a very powerful pattern.
If the Russell 2000 continues to drop it could be drawn to the secondary POC which is in the late November 2023 sideways correction.
The S&P 500 and Russell 2000 could reach their potential support zones by late April or early May 2024.
Traders are 100% short non- leveraged Russell 2000 funds from the 04/01/24 session open. Continue to hold short.
