The 04/15/24 Nasdaq Composite (IXIC) break below two important support levels opens the door for a move down to the January 2024 bottom.
This sites 04/13/24 blog illustrated that the IXIC may have completed a bullish Horizontal Triangle and the IXIC could make a new all-time high. The IXIC gapped up on the 04/15/24 open and rallied for 15 – minutes. That’s all the bulls could do, the rally was quickly retraced.
The daily IXIC chart courtesy of Trading View shows what happened.
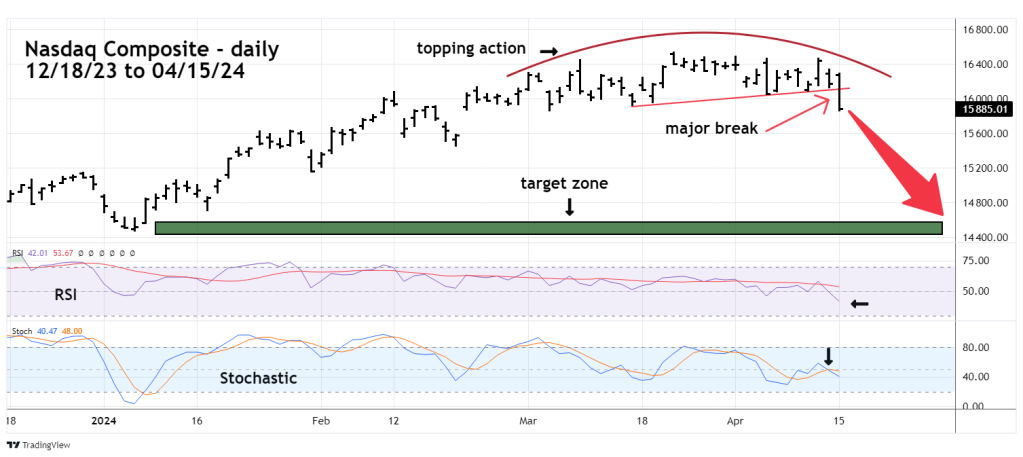
There were two possible termination points for the presumed Horizontal Triangle, the bottoms made on 04/10/24 and 04/04/24. IXIC blasted below both bottoms invalidating the Horizontal Triangle wave count.
In addition, IXIC had the most bearish daily performance down 1.79%, greater than both the S&P 500 and Dow Jones Industrial Average. It was down even more than the Russell 2000 drop of 1.37%.
Daily RSI is only at 42% the oversold zone begins at 30%.
Daily Stochastic had a bearish line cross in the neutral zone.
A two-month topping action is probably complete. The IXIC could reach its January 2024 bottom as soon as late April or early May 2024.
