The Russell 2000 (RUT) small cap stock index has declined 5.5% since its 03/28/24 peak.
From its 03/21/24 top the Dow Jones Industrial Average has fallen close to 4%.
The Nasdaq Composite from 03/21/24 to 04/10/24 is down 2.3%.
The S&P 500 from its 03/28/24 top has declined 2.4%.
The daily RUT chart courtesy of Trading View illustrates the action.
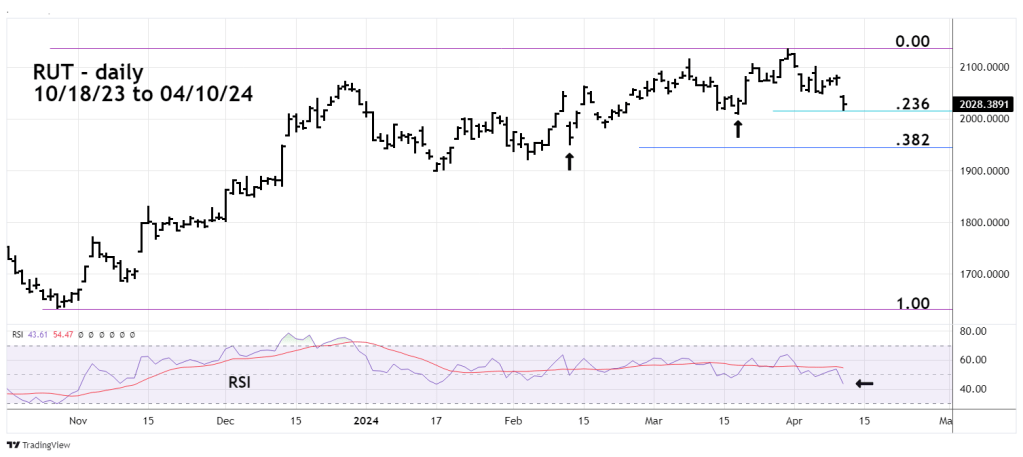
At the 04/10/24 low RUT had reached a Fibonacci .236 retracement of its October 2023 to March 2024 rally. This bottom is also close to a correction bottom made on 03/19/24. RUT could have a small move up on 04/11/24.
Daily RSI on 04/10/24 was at 43% the oversold zone begins at 30%,. The current RSI level implies lower RUT prices.
There’s a good chance RUT could soon reach the Fibonacci .382 retracement level which is just below a correction bottom made on 02/13/24 at 1950.46.
Traders are 100% short non – leveraged RUT funds from the RUT open on 04/01/24. Continue holding short.
