In the current cycle Nvidia Corporation (NVDA) is probably the king of all U.S. stocks. Long -term Elliott wave analysis suggests NVDA could soon begin a multi – month decline.
The monthly NVDA chart courtesy of Trading View illustrates its progress from the November 2008 bottom.
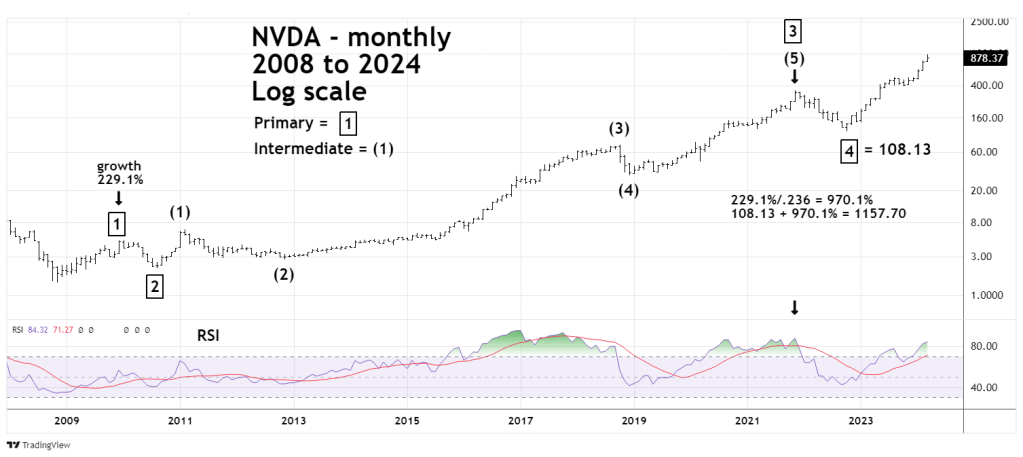
NVDA has formed an extended Elliott wave Impulse pattern. Typically, stocks and stock indices have their the longest and most powerful phase in the middle of an extended Impulse pattern. Note that Intermediate wave (3) is the longest in time and has largest gain. Also note that monthly RSI reached its highest point in the middle of Intermediate wave (3). Typically, momentum peaks in the middle of third waves.
Sometimes when stocks are in blowoff tops, RSI can reach its maximum level in conjunction with a price high. This happened at the November 2021 top. The same phenomenon could be occurring with the bull phase that began in October 2022.
Usually there’s a Fibonacci relationship between the first and fifth waves of an Impulse pattern. Because NVDA has such a large percentage move from the November 2008 bottom, its more appropriate to measure growth rates.
Primary wave “1” which peaked in December 2009 had a growth rate of 229.1% divided by the Fibonacci ratio of .236 equals a growth rate of 970.1%. The bottom of Primary wave “4” was 108.13, adding a growth rate of 970.1% to this bottom targets a Primary wave “5” peak at 1,157.70.
The all-time high made on 03/08/24 was 974.00. Markets and stocks tend to be drawn to round numbers. There’s a very good chance NVDA could soon reach at least 1,000.
If NVDA can soon make a significant peak the subsequent decline could last for sever months or a year. Note the eleven month decline from November 2021 to October 2022.
The minimum downside target is the October 2023 bottom – about a 60% drop. The maximum downside target is the October 2022 bottom – close to a 90% decline.
If you think the maximum downside projection is crazy, please look at the Apple Inc. (AAPL) 82% drop from March 2000 to December 2000.
